
How Spotlights Are Personalized

- Overview
- What Triggers A Spotlight
- How Your Spotlights Are Selected
- Data Quality & Timing
- What Personalization Does Not Include
- Related Articles
Overview
Spotlights surface statistically notable findings from your practice metrics — patterns that stand out relative to your peers or your own recent history. Personalization is applied automatically based on your real-world data. No configuration is required.
What Triggers A Spotlight
Each Spotlight reflects a finding that meets one or more of the following conditions:
- National ranking: your Metric falls in the top or bottom 15% among providers in your specialty nationally.
- State ranking: your Metric falls in the top or bottom 15% among providers in your specialty within your state.
- Facility ranking: your Metric stands out relative to providers at your facility.
- Month-over-month change: a Metric shifts by more than 10% compared to the prior month.
- Consecutive-month trend: a Metric shows consistent directional movement across multiple consecutive months.
- Specialty-specific code fraction: a procedure or diagnosis code represents an unusually high or low share of your activity relative to specialty norms.
Not every trigger condition will apply to every provider. Which Spotlights appear in your feed depends on your patient population, your specialty, and the patterns present in your data.

How Your Spotlights Are Selected
Jiro generates a minimum of four Spotlights per provider each month, then schedules at least one to display each week. The selection process follows several steps:
Pool construction. All Metrics that meet a trigger condition are collected into a candidate pool.
Domain-balanced pre-selection. From the pool, at least four candidates are scored and selected. The algorithm balances coverage across five metric domains, cost, pharmacy, work RVU, volume, and quality, so that no single domain occupies all of the available slots. This ensures your feed reflects your practice across multiple dimensions, not just the area with the most statistical activity.
Weekly scheduling. Pre-selected Spotlights are distributed across weeks, with at least one surfaced each week and findings from different domains represented each week.
Backfill. If a scheduled week falls below the minimum threshold, additional candidates from the pool are used to fill remaining slots.
Formatting. Each surfaced Spotlight is automatically formatted, the heading and supporting text are generated from the underlying finding and its statistical context.
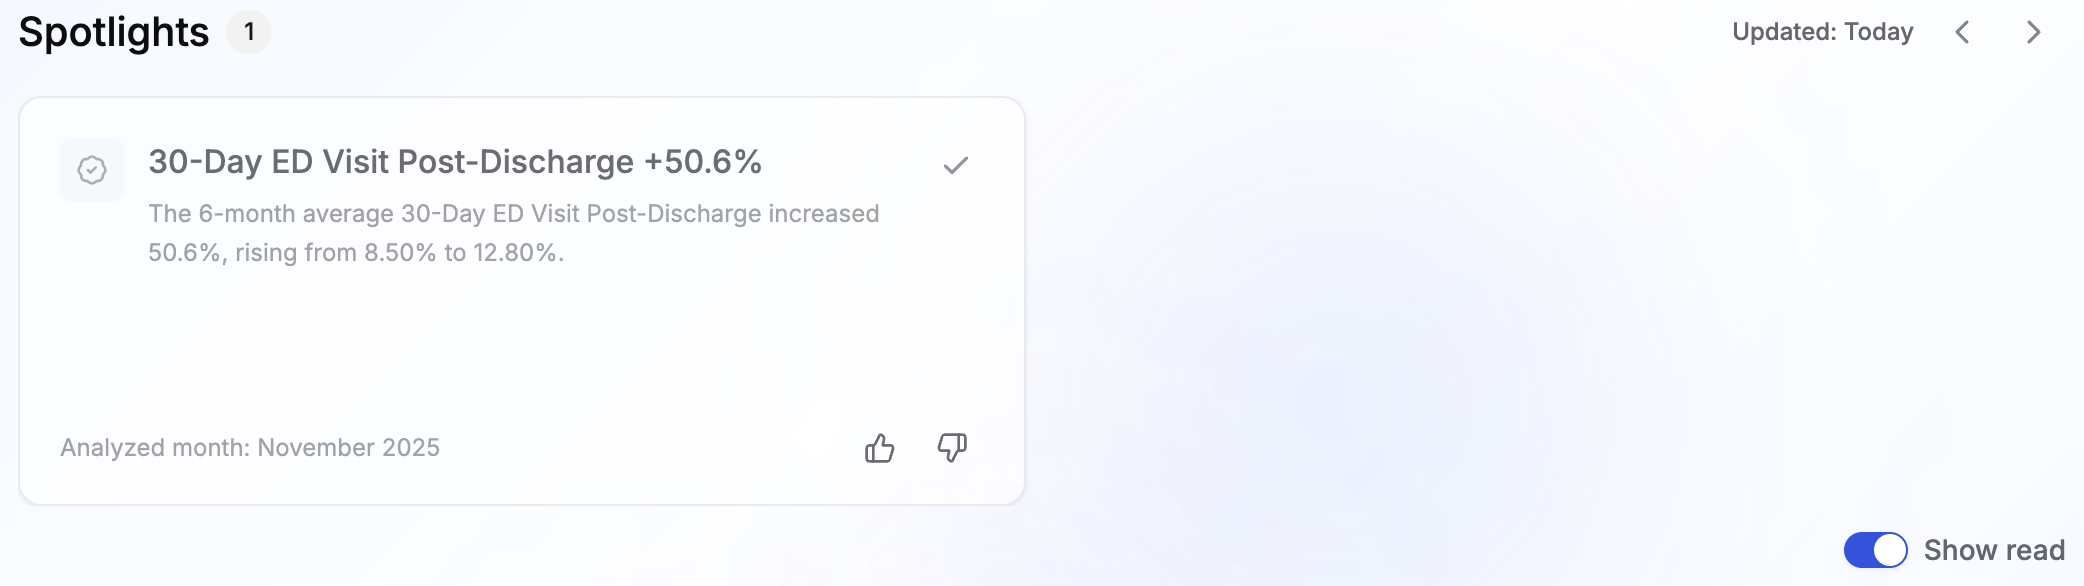
Spotlights remain active for four weeks from the date they are surfaced. Findings you dismiss or check mark are moved to the read section in your feed but remain visible as greyed-out cards. The cards can be viewed by toggling "show read" in the bottom right of the Spotlights section.
Data Quality & Timing
Before a finding reaches your feed, it passes a data quality check.
Data completeness. A finding will not be surfaced if the underlying data for your NPI falls below approximately 85% completeness at the metric level. Findings held for data quality reasons are not visible in your feed.
Comparable peer data. Spotlights involving peer comparisons require sufficient peer data to construct a meaningful comparison. Findings without adequate peer data are held until that data is available.
Data lag. Real-world data has inherent timing constraints: commercial claims data is typically available with approximately a 6-month delay, and claims from qualified entities carry approximately a 9-month delay. Spotlights are generated only from data that has cleared these windows. The most recent months of your activity will not yet appear in your Spotlights feed.
What Personalization Does Not Include
No case-mix adjustment in peer groups. Peer comparisons do not yet account for differences in patient complexity between providers. A practice with a higher-acuity patient population may appear as an outlier on certain metrics relative to a peer group that does not reflect similar patient burden. Case-mix adjustment is planned for a future release.
Specialty relevance gaps. The metric library covers broadly applicable measures. Some metrics may surface findings in specialties where the clinical relevance is limited. Coverage will be refined as the library matures.
Coded data only. Spotlights are derived from existing metrics only. All of the Metrics Spotlights are derived from can be found in your dashboard or through Metric Selection.