
How Spotlights Work
- Overview
- Spotlight Generation
- How Spotlights Are Selected
- What Each Spotlight Shows
- Feed Cadence & Dismissal
- Data & Timing Considerations
- Spotlight Feedback
- What Your Spotlight Personalization Does Not Include
- Important To Remember
- Related Articles
Overview
This article explains how Spotlights are selected, formatted, and delivered to your feed, and what to keep in mind when reviewing them.
Spotlight Generation
Spotlights are generated through a structured process each month:
- Candidate pool. Spotlight candidates are generated from your Metrics based on the trigger conditions described in How Spotlights Are Selected.
- Pre-selection. The top candidates are scored, balancing domain diversity so no single category dominates your feed.
- Weekly assignment. At least one selected Spotlight surfaces in your Practice feed each week.
- Backfill. If a week falls below the minimum, additional candidates fill the remaining slots.
- Formatting. Each Spotlight receives a short, plain-language title and context, including the Metric, time period, and comparison group.
Data Quality Gate
Spotlights only surface from data that meets a completeness threshold of approximately 85%. If your data does not yet meet this threshold for a given period, no Spotlight will be generated for that period.
How Spotlights Are Selected
Spotlights are triggered by three types of signals in your data:
Peer Ranking: Your Metric falls in the top or bottom 15% nationally, within your state, or within your facility.
Time Trend: Your Metric has changed by more than 10% month over month, or has grown for two or more consecutive months.
Specialty Leaderboard: You rank in the top percentile for a specific diagnostic code, procedure, or prescription category within your state or nationally.
What Each Spotlight Shows
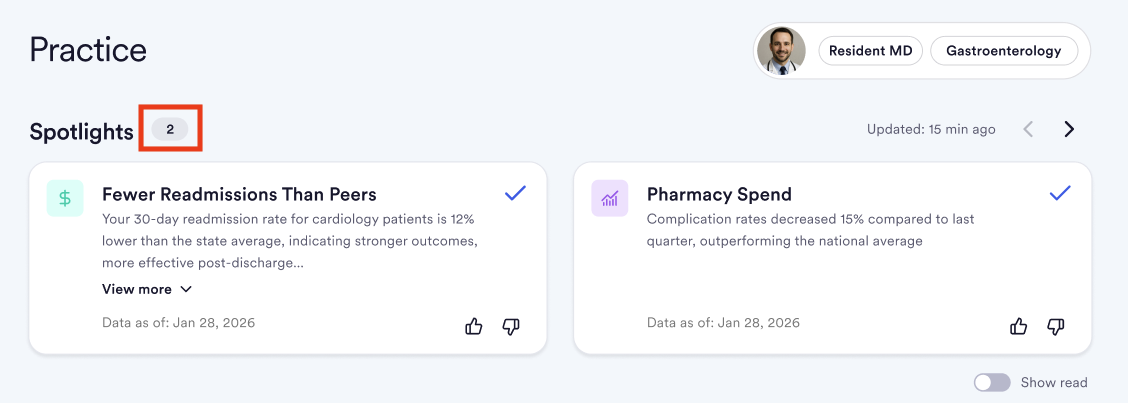
- Icon: Indicates the clinical category the Spotlight refers to.
- Title: The name of the Metric, the value of the change shown as a rate, percentage, volume, average, median, dollar amount, or number of days depending on the Metric, and the geographic region or peer group used for comparison.
- Check mark: Moves the Spotlight to your "read" section.
- Analyzed month: The month of data the Spotlight is derived from.
- Info icon: Directs you to the drill-down view for this Metric in the Clinical tab. For example, if a Spotlight is based on the metric "Description" for Apr 2026, set your filters to “Complete" and "All locations," then click the Metric in the Clinical tab to dig deeper.
- Thumbs up/down: Lets you submit feedback on the Spotlight.

Feed Cadence & Dismissal
Spotlights surface from your entire Clinical Performance Metrics library, including Metrics you have not saved to your dashboard. The selection process favors distinct stories, so closely related Metrics are unlikely to surface in the same cycle.
Cadence
- At least one new Spotlight is surfaced each week following your first published Spotlight
- Up to 16 Spotlights may be available in your feed at any one time
- Each Spotlight expires four weeks after it is surfaced, regardless of whether you have viewed or dismissed it
- Historical Spotlights are retained in the database for reference after they expire from the active feed
Dismissal
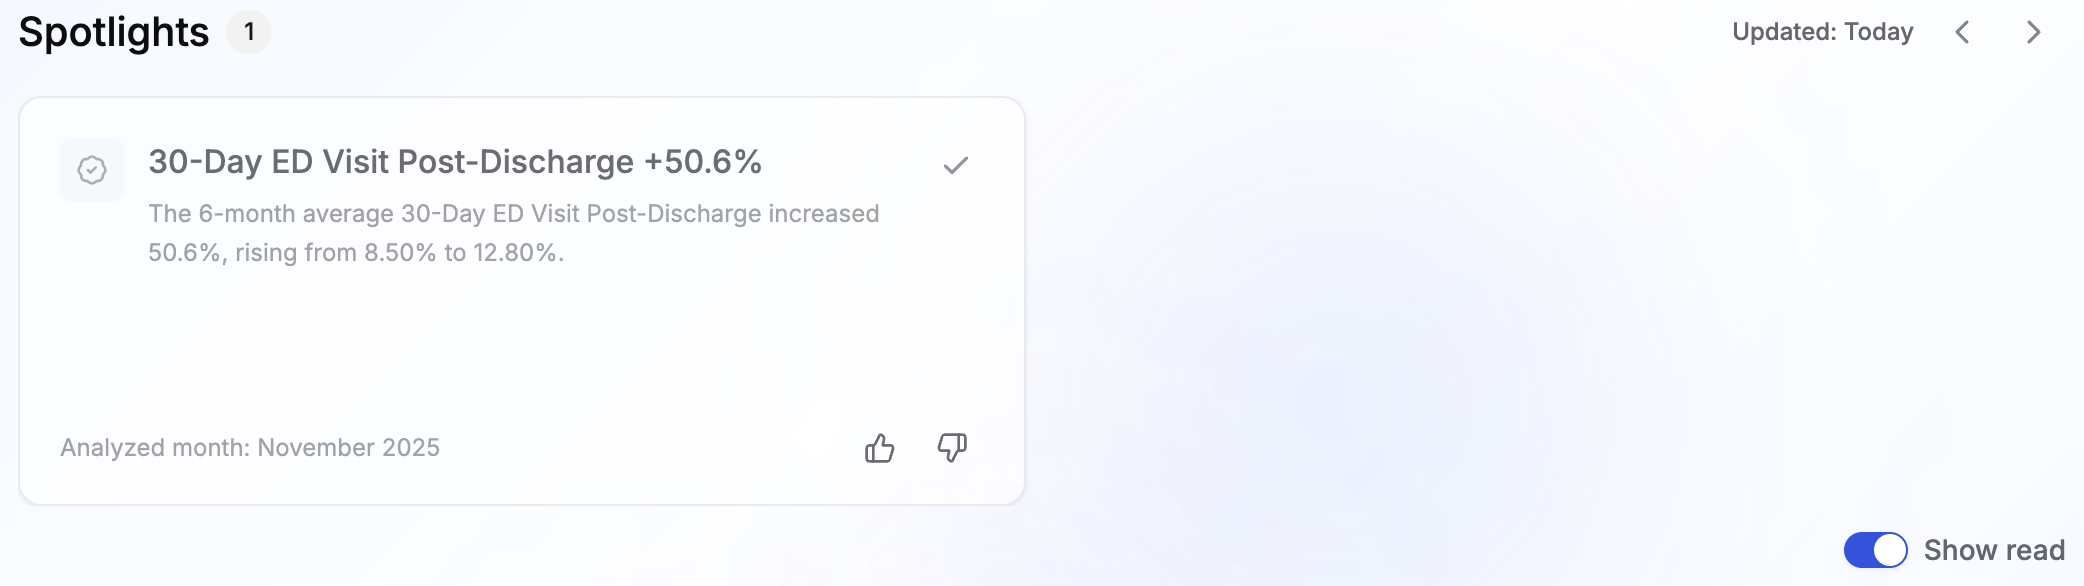
Dismissing a Spotlight, using the checkmark in the top right of the card, removes it from the carousel. Toggle "Show read" to bring dismissed or read Spotlights back into view.
Data & Timing Considerations
Claims Data Lag
Open and closed commercial claims may take up to six months to become fully available. Medicare, Medicaid, and QE data may take up to nine months to surface.
Exclusions
A finding will not surface if the underlying data falls below approximately 85% completeness at the Metric level, if the comparison group includes fewer than 11 clinicians, or if there is not enough peer data for a meaningful comparison.
Peer Comparisons & Geography
Spotlights may compare you to your peers at the facility, state, or national level, depending on data availability and whether a notable comparison exists. The comparison group is noted on the Spotlight itself. Not all Spotlights are peer comparisons, some track emerging trends within your own practice by comparing you to your own historical data.
Currently, Spotlights aggregate your practice data across every facility and state where you practice. A more granular view, limited to your data in the specific state used for comparison, is planned for a future release.
Feed Limits & Duration
There is no limit to the number of Spotlights that can appear in your feed. You can view previously seen Spotlights at any time by toggling "Show read."
Spotlights move to read status automatically after four weeks. You can also move a Spotlight to read manually by clicking the checkmark, or return it to your active feed from the "Show read" view using the same checkmark.
Giving Feedback On A Spotlight
In the bottom right hand corner of a Spotlight, the thumbs-up and thumbs-down icons are available for you to provide feedback. Choosing either option will open a "Tell us more" modal to elaborate on your experience. Selecting a category or writing in the text box is optional, but helps the Jiro team understand what is working well and where Spotlights can be improved. Once you are finished, click the submit button.
Submitting negative feedback does not directly change your Spotlights feed. Your individual response is monitored alongside others to make improvements to Spotlights over time.

What Your Spotlight Personalization Does Not Include
No case-mix adjustment in peer groups. Peer comparisons do not yet account for differences in patient complexity between providers. Case-mix adjustment is planned for a future release.
Specialty relevance gaps. The metric library covers broadly applicable measures. Some metrics may surface findings in specialties where the clinical relevance is limited. Coverage will be refined as the library matures.
Coded data only. Spotlights are derived from existing metrics only. All of the Metrics Spotlights are derived from can be found in the dashboard or through Metric selection but Spotlights cannot be configured by a user. A user can dig deeper by setting their Clinical Performance filters to complete and all locations, then selecting the Metric that a given Spotlight is surfacing. This will allow them to view cohort breakdowns and breakdowns by diagnosis.
Important To Remember
- Spotlights reflect correlations in your data, not causation.
- Peer group matching is based on your self-selected specialty and location. Make sure your specialty reflects the benchmark group you should be in. Highly specialized subspecialists may have limited peer comparison groups.
- No case-mix adjustment in peer groups yet. Peer comparisons do not account for differences in patient complexity between providers. Case-mix adjustment is planned for a future release.
- Specialty relevance gaps remain. The Metric library covers broadly applicable measures, so some Metrics may surface findings in specialties where clinical relevance is limited. Coverage will be refined as the library matures.
- Spotlights do not reflect current clinical activity. All data has an inherent lag.
- Coded data only. Spotlights are derived from existing Metrics, which you can find in your dashboard or through Metric selection, but Spotlights themselves cannot be configured. To dig deeper, set your Clinical Performance filters to "Complete” and "All locations," then select the Metric a Spotlight is based on to view cohort and diagnosis breakdowns.
- Feedback provided on Spotlights does not immediately affect your feed.
- New accounts may not see Spotlights immediately. Spotlight generation runs shortly after your signup data is processed, and full coverage builds over time as more data accumulates.