
How Practice Works
Purpose
This article explains how Practice is built, the data that is collected, attributed, calculated, and surfaced, so you can accurately interpret how your practice is performing.
How It Works
Data Collection
Real-world data attributed to your practice is sourced from a third-party claims data provider and ingested into Jiro on a regular basis. This includes medical encounters, pharmacy fills, diagnoses, procedures, and referral patterns.
Attribution
Patients and their associated prescriptions, encounters, and referrals are attributed to you using your National Provider Identifier (NPI). Only patients linked to your NPI are included in your Practice.
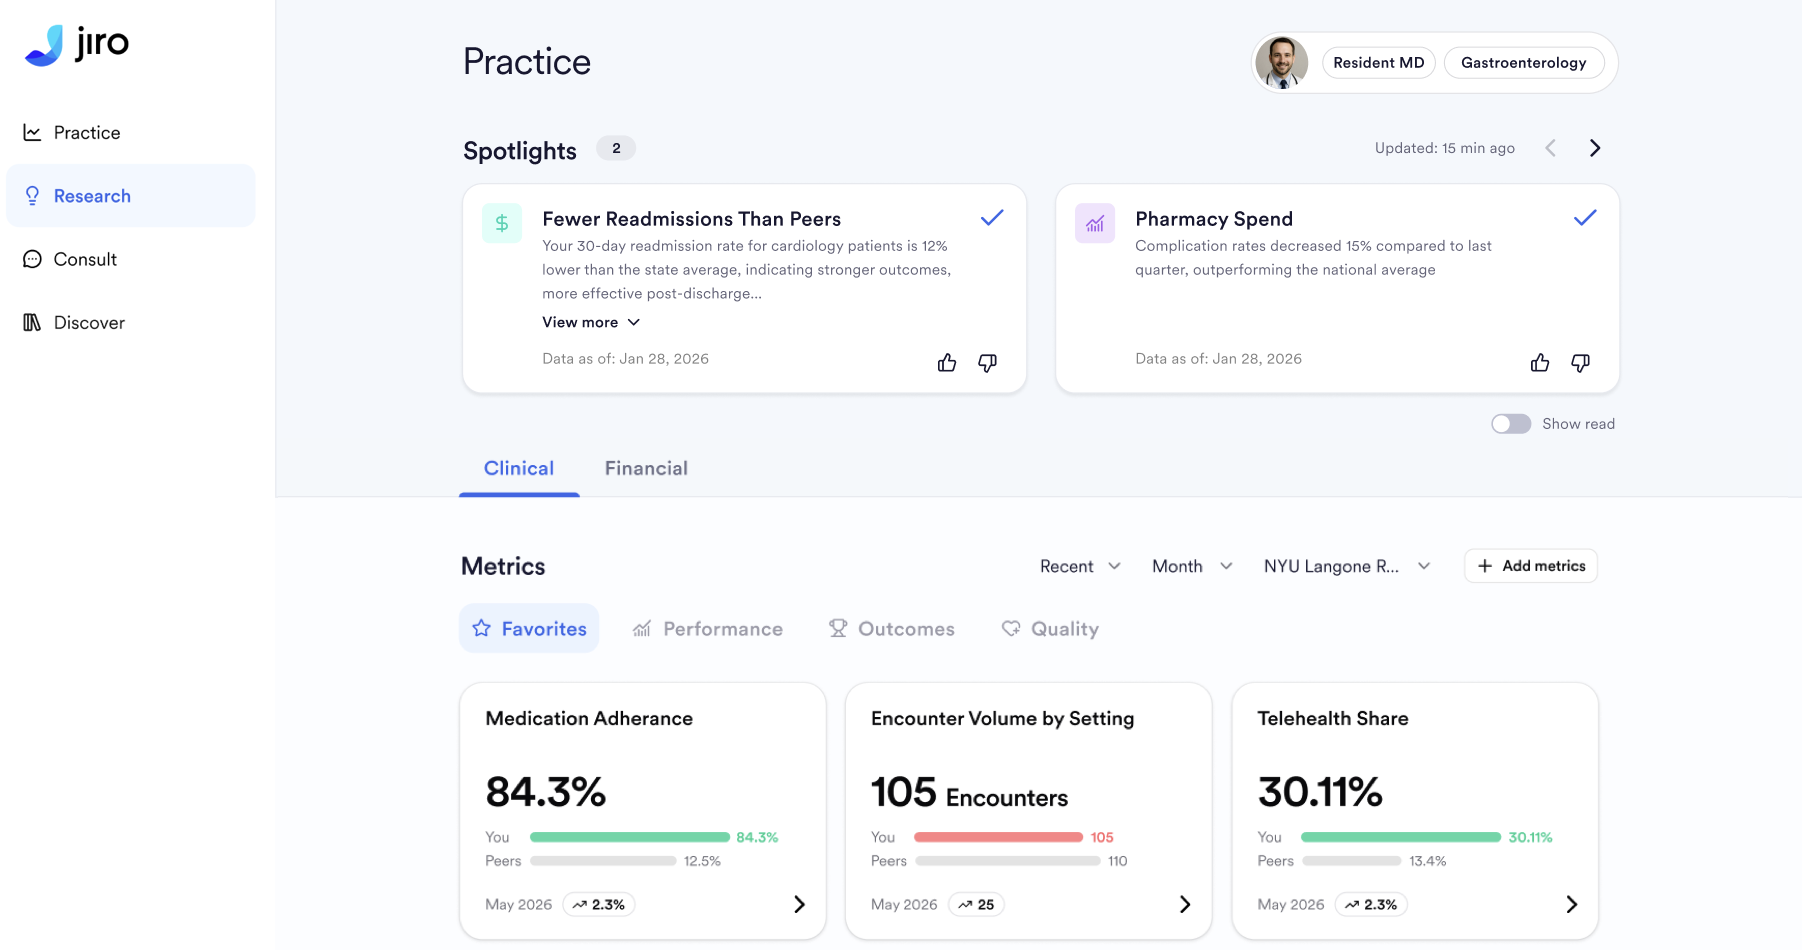
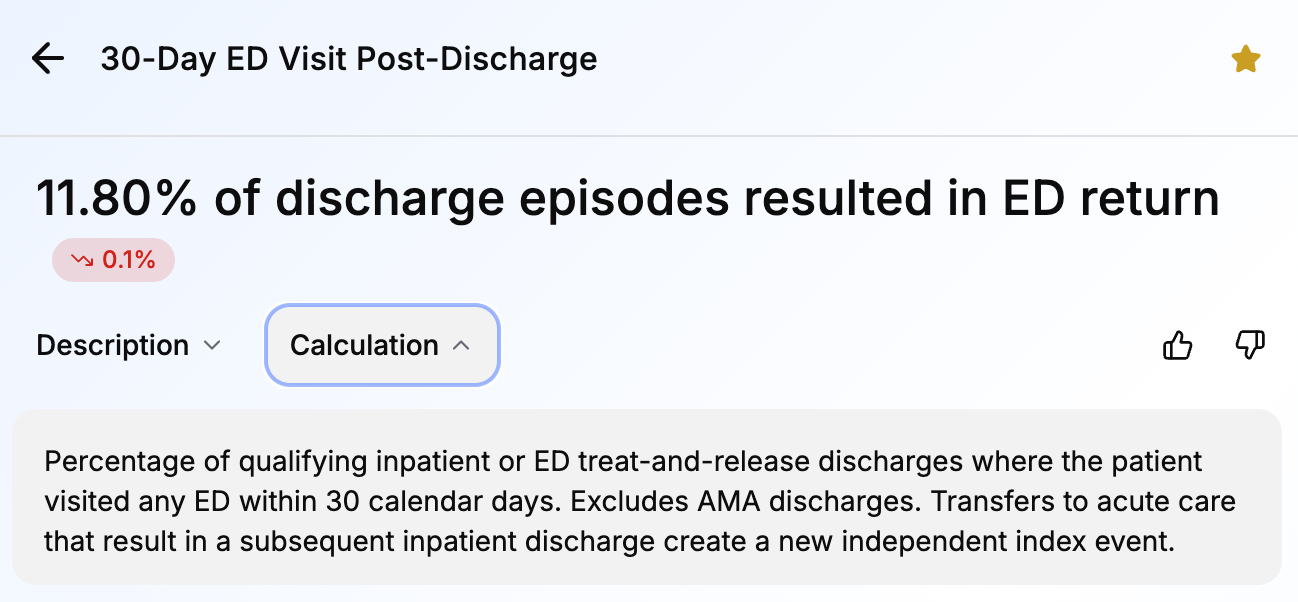
Metric Calculation
Each Metric is calculated using defined clinical rules applied to your attributed patient population. Values are expressed as rates or percentages rather than absolute counts. Rules and calculations can be found in the drill-down of each Metric.
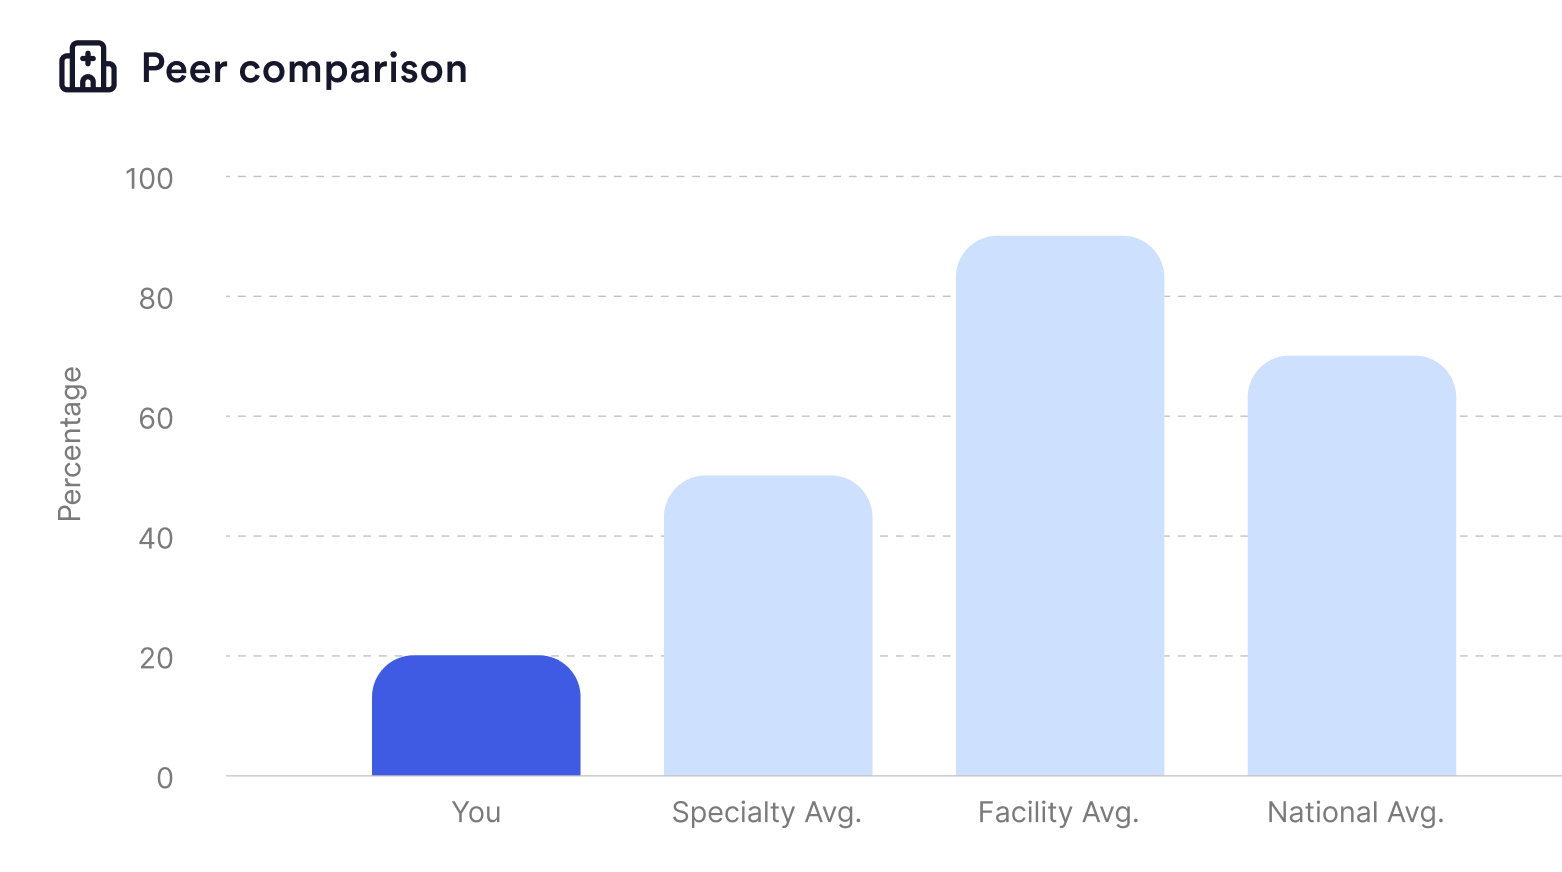
Peer Benchmarking
Your Metric values are compared against anonymized data from peer physicians. Comparison groups are defined using specialty, facility type, state, and national averages, and are adjusted to support meaningful comparisons across different practice contexts.
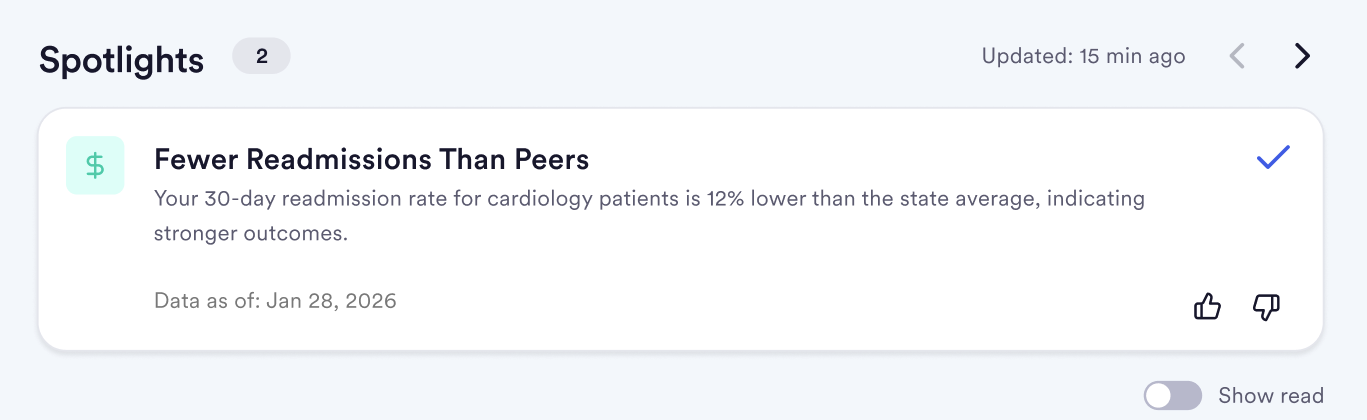
Spotlights
Jiro automatically identifies statistically notable patterns from your data and surfaces them as Spotlights. Spotlights are generated using threshold-based logic, they appear when your data crosses a statistical boundary relative to peers or your own history.
Referral Matching
Referral relationships are identified by tracking when you are listed on the referral as the referrer, or when you receive the referral and have someone else as a referrer on that claim. The findings are listed in the Received and Sent tabs under Referral Analysis in the Financial tab of Practice.
Specialty Filtering
Metrics are filtered based on your primary specialty to ensure the data shown is relevant to your clinical scope. You can change the Metrics you see by selecting or favoriting Metrics. To learn more about the Metrics you see and favoriting Metrics, view the Metrics: Overview page.
Data Sources & Timing
Where the Data Comes From
- Medical claims data (open and closed) attributed to your NPI
How Often It Updates
- Metrics refresh on a rolling basis as new data becomes available, usually once a month but depends on the specific Metric
- Spotlights are surfaced on a weekly cadence
- Referrals update depending on data delivery cycles, usually once a month
Important To Remember
Medical claims data lag and quality are dependent on the recency you select. Overall there is an inherent lag of approximately 30 to 90 days between the date of care and its appearance in Jiro. For this reason, most recent months of data may be incomplete at the time of viewing.