
How Metrics Work
Purpose
This article explains how to navigate Metrics and how individual Metric values are calculated from the underlying data.
Navigating Metrics
- Open Metrics. Navigate to the Practice section of Jiro and view the Metrics section at the bottom of the page. Metrics will default to the “Clinical” tab.
- Review your Metrics. The Clinical tab of Metrics load with Metric cards pre-selected for your self-selected specialty. Each card shows your current value. Switch between the Clinical and Financial tabs to see the full set of available Metrics.

- Drill into a Metric. Select any Metric card to open the drill-down view. Here you will find a time trend chart, visual indicator of where you fall relative to your peers, a peer comparison chart, patient cohort breakdowns by age, sex, race, and insurance type, and a top diagnosis breakdown. Hover over any data point to see the underlying sample size (N) and additional context.

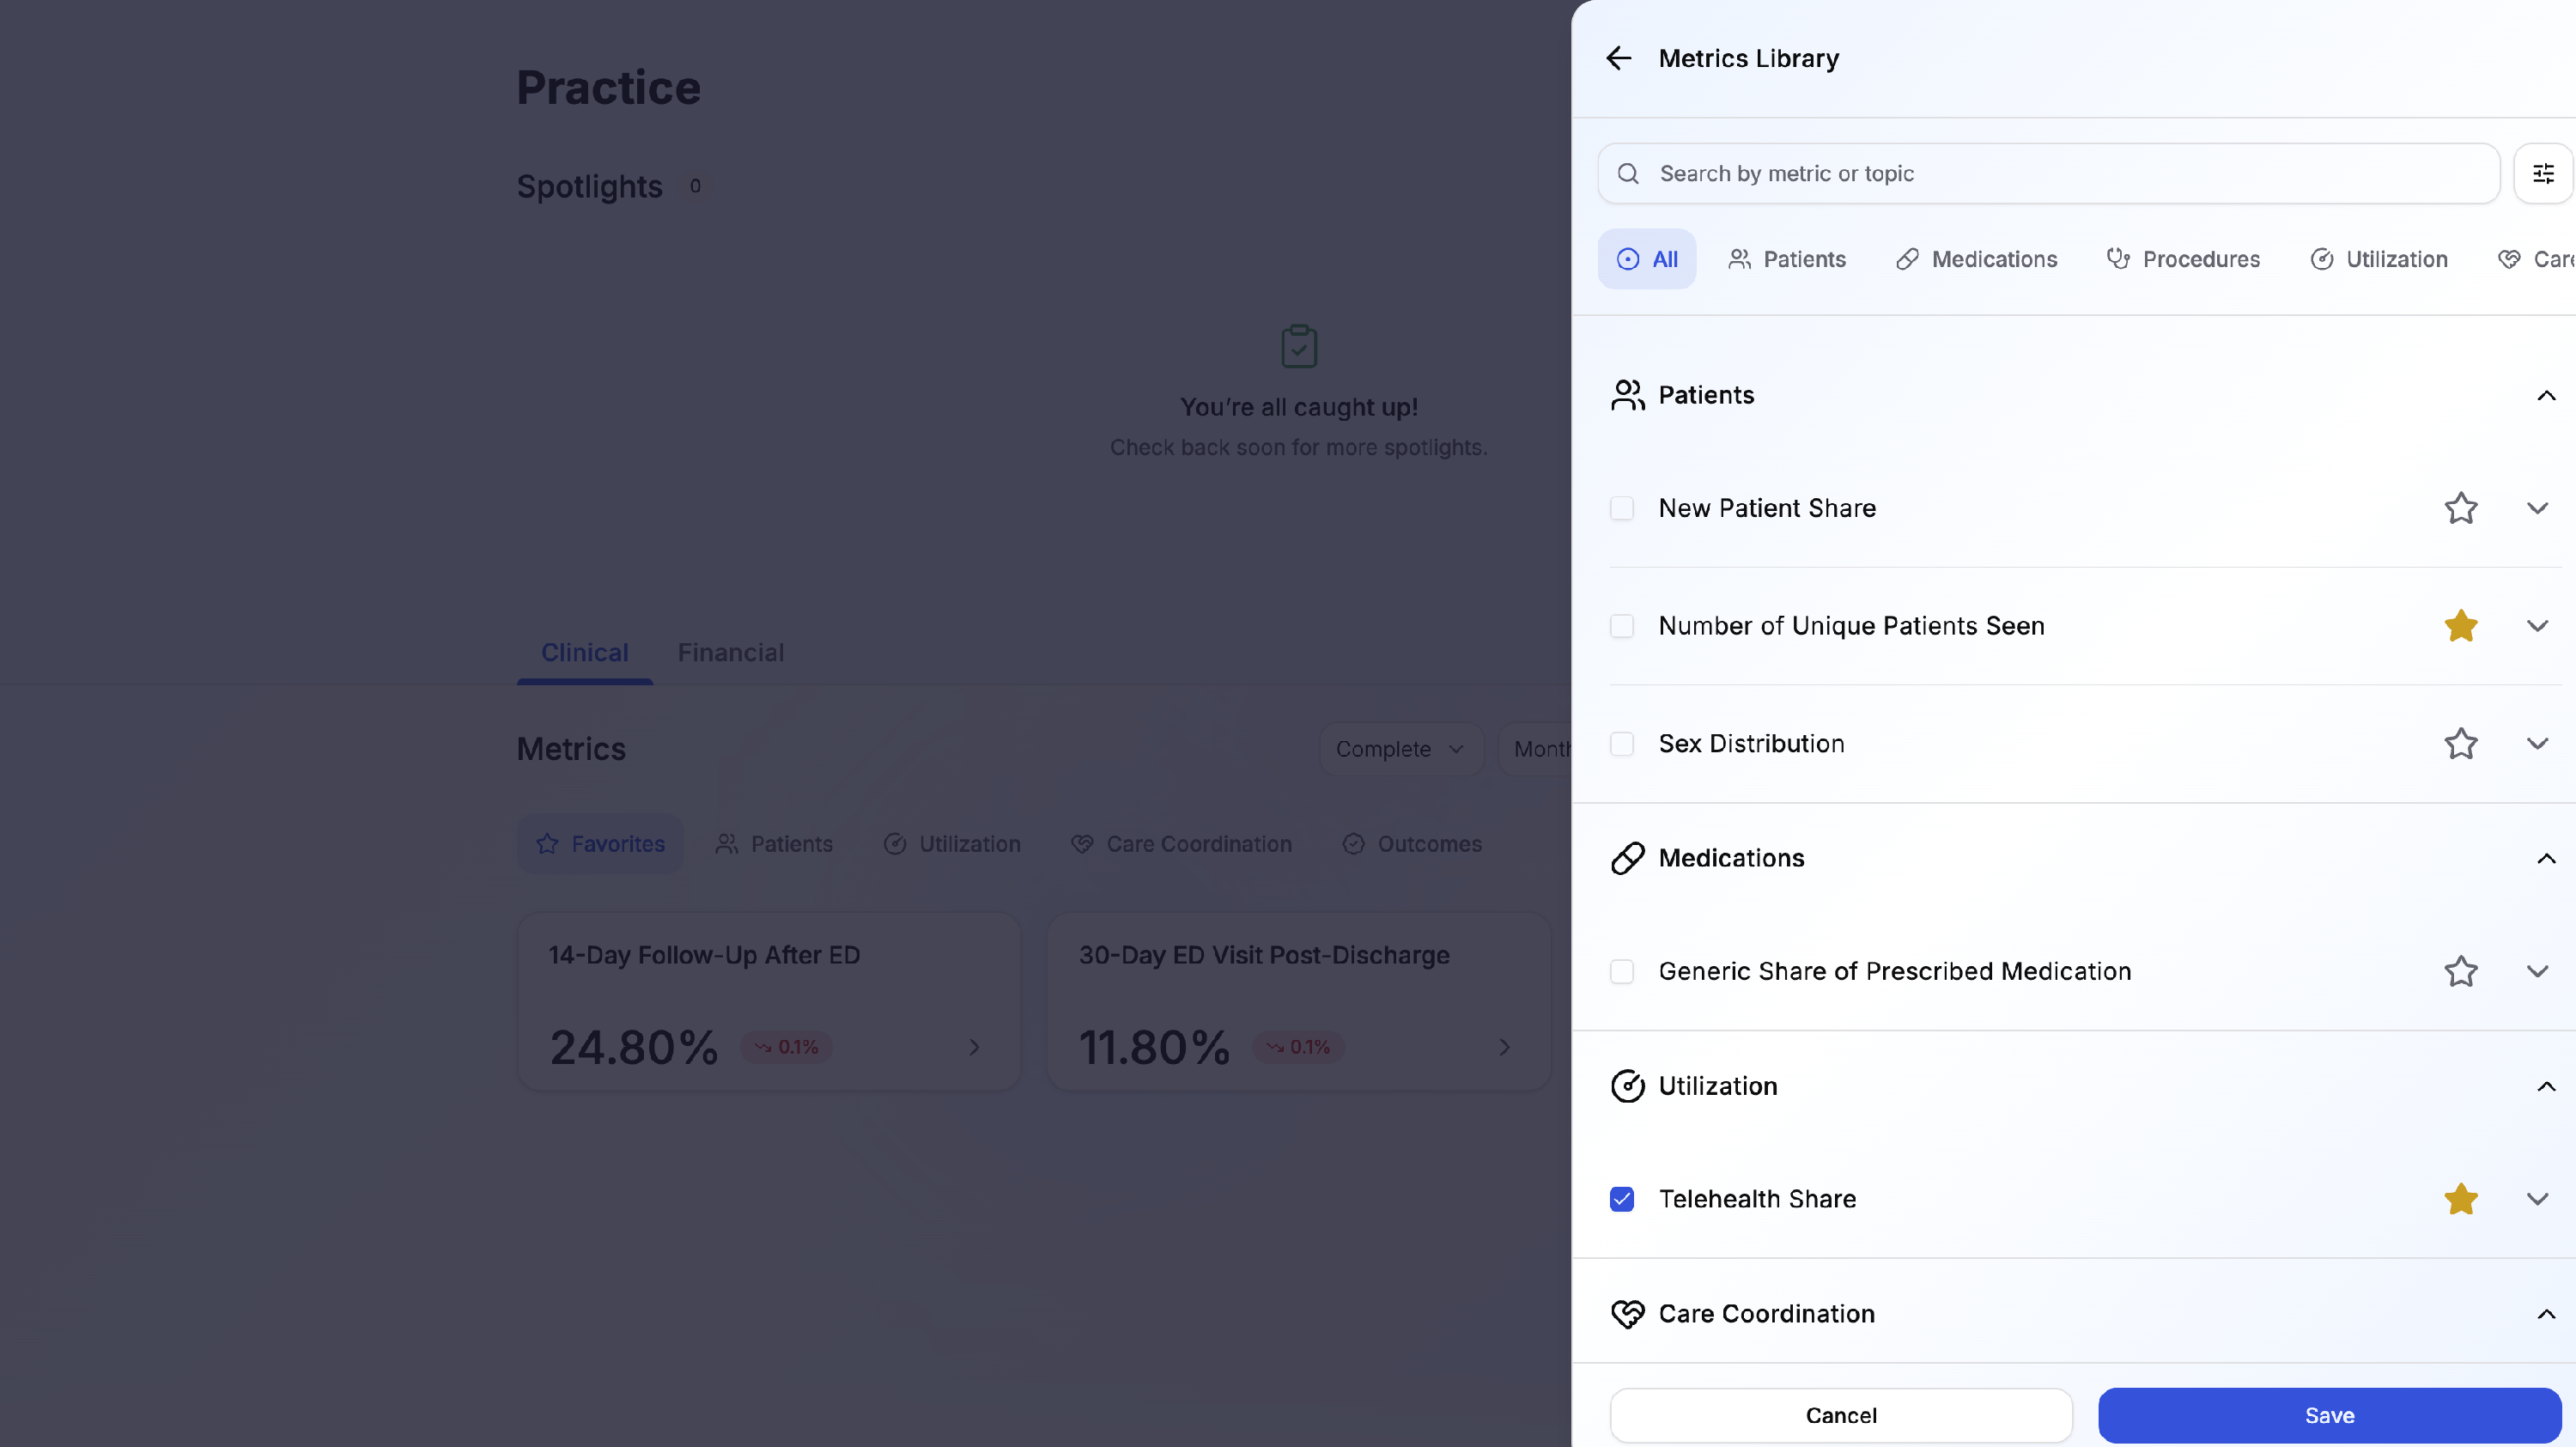
- Customize your view. Select "Metrics Library" from your dashboard to browse the full catalog of available Metrics for your specialty. From there you can add or remove Metrics, mark favorites by clicking on the star to the right of a metric, and filter by category.
- Use the filters. Use Latest, Recent, or Complete data recency filters to view different levels of completeness of your Metrics, the time toggle to switch between monthly and annual views, and the location filter to narrow results to a specific site.
How Metrics Are Calculated
Data Sources
- Open and closed claims data
- Pharmacy claims
- Specialty and NPI data
- RVU and compensation data from MGMA and self-reported through the compensation form
Cohorts and Denominators
Each Metric defines a specific patient cohort as its denominator. Patients are grouped into clinically meaningful categories, and both the numerator and denominator for each Metric are clearly defined in the drill-down view.

Attribution and Refresh
Metrics are calculated over a defined measurement period and refreshed on a regular cadence as new data becomes available. The applicable date range is displayed on each Metric card.
Standardization
Certain Metrics are normalized to support meaningful comparisons across clinicians with different practice volumes or patient populations.