
How Metrics Are Personalized

- Overview
- Your Specialty-Based Dashboard
- Selecting Your Metrics
- Peer Benchmarks
- Location Filter
- Time Toggle
- What Personalization Does Not Include
- Related Articles
Overview
Metrics adapts to your practice in two ways: automatically, through specialty-based pre-selection and peer benchmarking tied to your specialty, and manually, through dashboard selections and favorites you control.
Your Specialty-Based Dashboard
When you open Metrics for the first time, your dashboard arrives pre-configured with metrics relevant to your specialty. Jiro selects these from a specialty-weighted shortlist, the measures most commonly meaningful to providers in your field.
This selection is not fixed. You can add, remove, or mark any metric as a favorite at any time using the Metrics Library.
First-Visit Guided Selection
On your first visit, a guided flow prompts you to confirm or adjust your favorite metrics. Step through the specialty-curated shortlist and mark the metrics most relevant to your practice. You can complete this now or return to it later from the Metrics Library.
Selecting Your Metrics
Metrics Library
Select Metrics Library from your dashboard to open the full catalog of available metrics for your specialty. From the library you can:
- Add or remove metrics from your dashboard
- Mark metrics as favorites
- Filter the catalog by category (Patients, Medications, Procedures, Utilization, Care Coordination, Outcomes)
Metrics you add appear as cards on your dashboard. Metrics you remove are saved in the library and can be added back at any time.

Clinical & Financial Tabs
Your dashboard is organized into two tabs:
Clinical: Clinical metrics covering diagnoses treated, medications prescribed, patient population characteristics, and care patterns.
Financial: Financial metrics including referral patterns, RVU-based compensation benchmarks, and coding efficiency analysis. To learn more about the Financial tab, see Referrals: Overview.
Peer Benchmarks
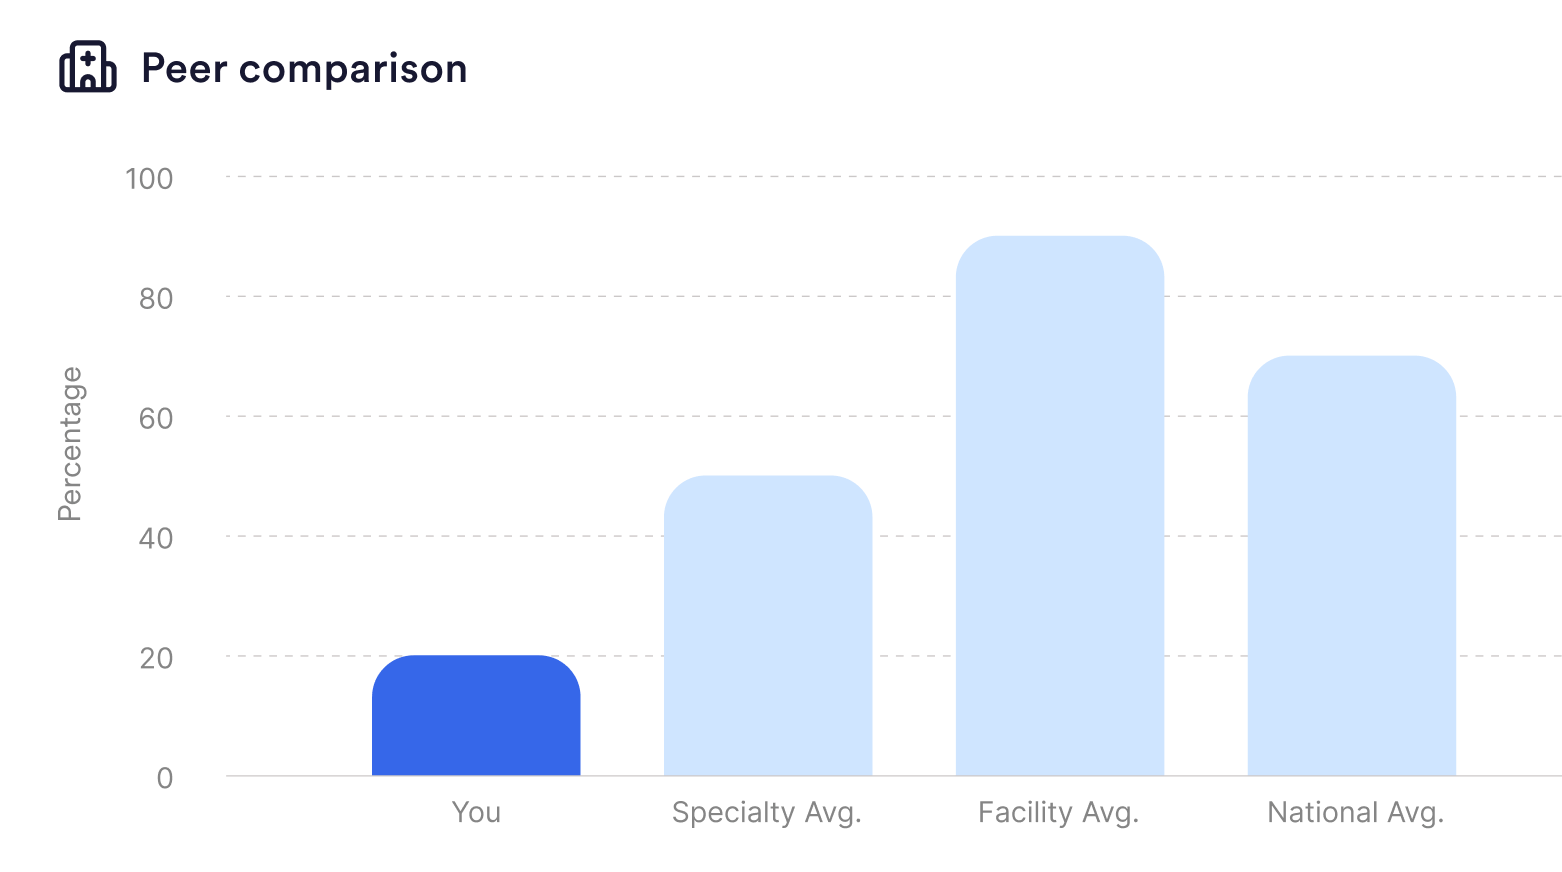
Every metric on your dashboard is benchmarked against your specialty peers in your state. The peer group is determined by your selected specialty. You will see your value alongside a visual indicator showing where you fall relative to that group.
National benchmarks are also available. Open any metric's drill-down view to see how your value compares to providers in your specialty across the country.
If you practice across multiple specialties, the peer comparison reflects your primary NPI-linked specialty and may not capture your full scope of work.
Location Filter
If you practice at more than one site, use the location filter at the top of the Metrics page to narrow results to a specific practice location. This lets you compare your patterns across sites or focus on a single one.

Time Toggle
Each metric can be viewed in either a monthly or annual view. Use the time toggle to switch between them. Monthly view shows shorter-term changes; annual view smooths fluctuations and surfaces longer-term trends.
What Personalization Does Not Include
No case-mix adjustment in peer groups. Peer benchmarks do not yet account for differences in patient complexity between providers. A practice with a higher-acuity population may appear as an outlier on certain metrics relative to a peer group that does not reflect similar patient burden. Case-mix adjustment is planned for a future release.
Claims-based data only. Metrics are derived from diagnoses, procedures, and prescriptions appearing in adjudicated real-world data. Encounters that were not billed, services paid out of pocket, and billing errors will not appear in your metrics.
Small sample suppression. Metrics with an insufficient underlying sample size will not display a result.