
How Practice Is Personalized
- Overview
- What Drives Personalization
- Personalized Items In Practice
- What You Can Control
- A Note On Data Availability
- Important To Remember
- Related Articles
Overview
Your Practice is built to be personalized to you. Your NPI connects claims data and patient encounters to you while your specialty selection determines the pre-configured metrics that appear in the performance section of your practice as well as the peer benchmarking associated with those metrics. This ensures that the signals you see are clinically and operationally relevant to your practice so you can track what matters to your patient population, referral and reimbursement patterns, and operational goals.
What Drives Personalization
Your NPI & Claims History
Your National Provider Identifier (NPI) anchors all personalization in Practice. It ensures your dashboard reflects your specific patient population and practice patterns, not generic benchmarks for all clinicians. Your NPI maps to your diagnoses, procedures, prescriptions, and payer mix from de-identified, aggregated claims data, which forms the foundation for every metric on your dashboard.
Your NPI is set when you join Jiro and cannot be changed. It remains the identifier for all your practice data.
Your Specialty Selection
Your specialty defines your peer group and metrics that are populated prior to your first sign in. All benchmarks on your Practice page are calculated within your specialty cohort, not across all clinicians nationally. This ensures your comparisons are clinically meaningful.
You can update your specialty at any time from your profile page under the clinician tab. Benchmarks will reflect your updated peer group on the next monthly data refresh.
Personalized Items In Practice
Your Spotlights
Spotlights surface notable Metrics in your practice each month. Each week, new Spotlights are generated, distributed, and will remain for four weeks. They fall into three categories:
- Peer standing: Your metrics in the top or bottom 15% nationally, by state, or within your facility.
- Meaningful trends: Month-over-month change of 10% or greater, or consistent growth across multiple months.
- Leaderboard moments: Your ranking in the top percentile nationally or by state for a specific diagnosis, procedure, or prescription category.
The algorithm surfaces distinct stories to avoid surfacing closely related Metrics in the same cycle.
You can dismiss Spotlights that no longer feel relevant. Dismissal does not affect your underlying metrics or benchmarks. Historical Spotlights are saved for reference.

Metrics & Peer Comparisons
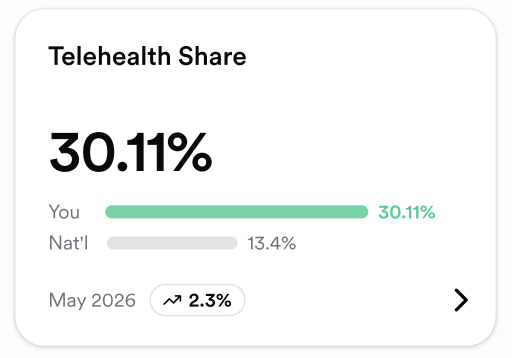
Each of the populated Metrics in the Clinical Performance section of Practice provide a personalized statistic for you. Based on the data tied to your NPI. Below the statistic, a peer comparison is provided highlighting how clinicians in your selected specialty perform in the same Metric.
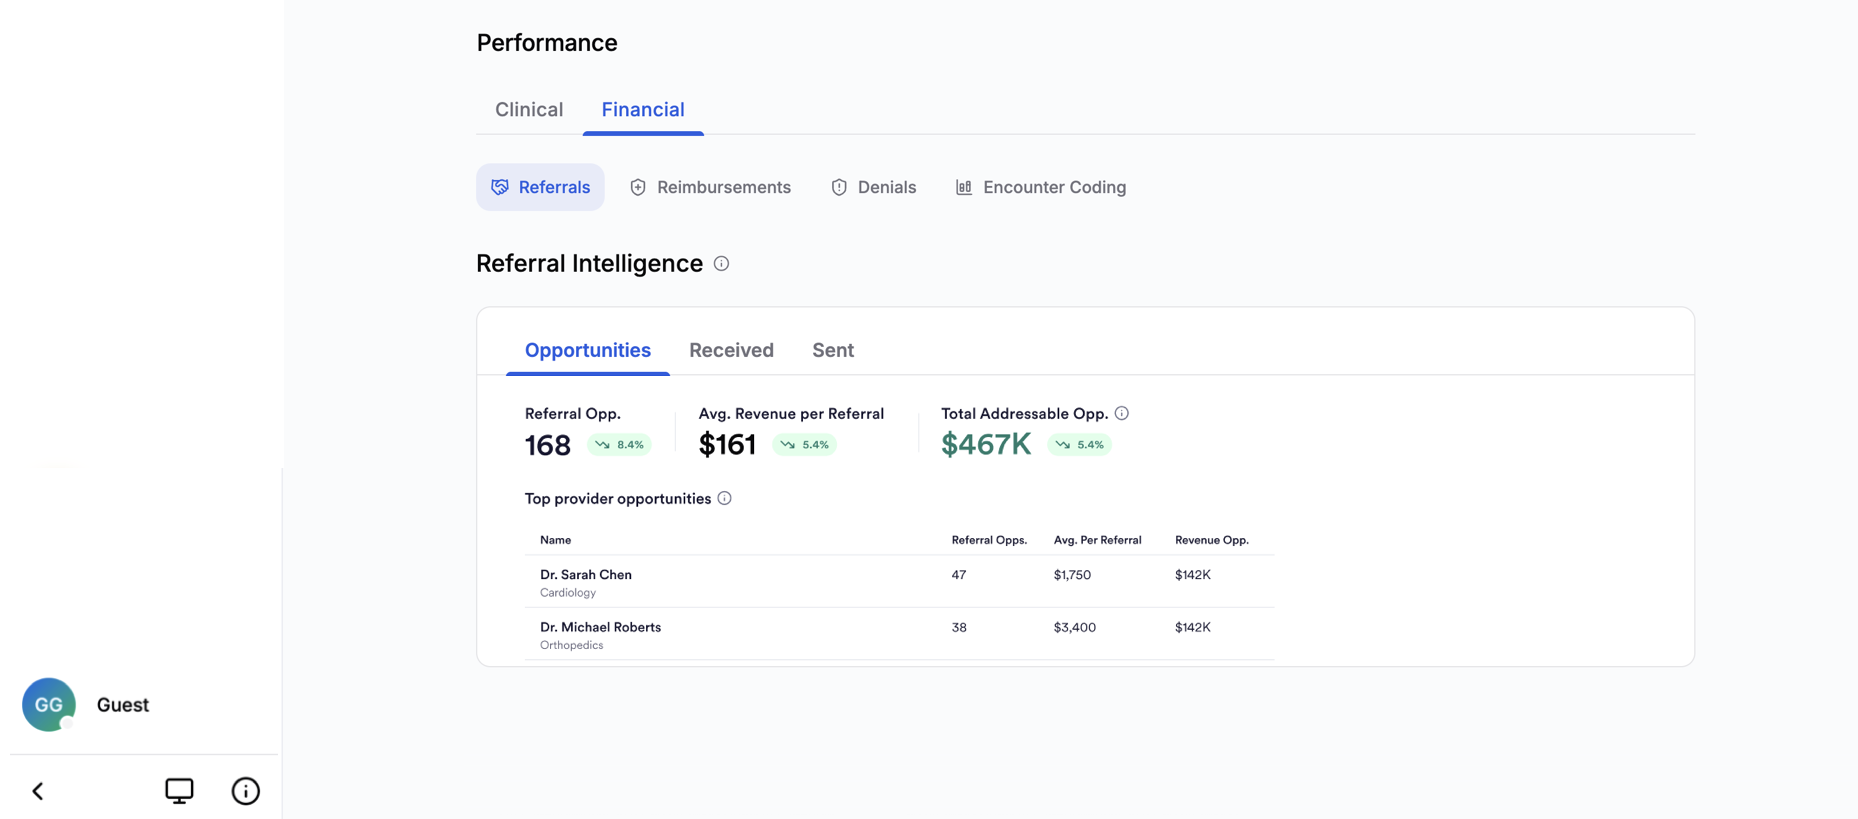
Financial Performance
Referrals, Reimbursements, Denials, and Encounter Coding give you insight into the financial performance of your practice using data linked to your NPI. Each highlights potential opportunities for you to improve your practice's financial standing.
What You Can Control In Practice
Read & Dismissed Spotlights
You can dismiss read Spotlights by clicking the check mark at the top right of the Spotlight card. This moves the Spotlight to your "read" section, which you can access by selecting the "Show read" toggle in the bottom right of the Spotlights section.
Your Selected & Favorite Metrics
On your first visit to Practice, the Clinical tab of the Performance loads Metrics cards that are pre-selected based on your selected specialty. You can modify your visible Metrics and set your favorites in the Metrics Library.
To configure favorites and populated:
- Click on the Metrics library gear button on the top right of the Clinical tab.
- View the Metrics catalog or sort by category.
- To populate a Metric to your Practice, select the check box icon to the left of the Metric name. This will load the Metric into the corresponding category in your Clinical tab.
- To favorite a Metric, select the star icon to the right of the Metric name. Your favorite Metric selections will appear in the favorites section of the clinical tab.
- You can access your Metrics Library to add, remove, or re-favorite metrics at any time.
All available Metrics remain in your library regardless of favorite or selected status. You can make changes to your visible or favorite Metrics at any time.
Filters
You can adjust what you see on your Practice page without affecting the underlying personalization.
- Time period: View metrics and benchmarks for a specific month or time window. Currently, only the monthly view is supported.
- Location: Filter by care location if you practice in multiple settings.
- Data quality: Select the quality of data you see in your Metrics. Three views exist: complete, recent, and latest. Complete features fully processes data, recent data provides more data coverage but is less accurate, latest is the most up-to-date data Jiro has available but may be incomplete. For the clearest view of your practice, use the Complete filter.

A Note On Data Availability
Claims data typically has a lag of up to 6 months. As your claims become available, your dashboard becomes richer and more precise. If you have limited claims history (for example, if you recently joined your organization or changed NPIs), some Metric categories may show fewer data points until sufficient claims volume is processed.
If your Practice appears to have missing data or unexpected numbers, try filtering by data quality to focus on your most complete months, then allow a full monthly refresh cycle. If the issue persists, reach out to support via the help button.
To learn more about how your data refreshes view Time & Refresh Cadence.
Important To Remember
- Your NPI determines the claims data that produces statistics for your metrics, the foundational calculation.
- Your specialty selection narrows benchmarks to clinicians in your field and populates an initial set of Metrics to your Practice. Modifying your Metrics changes visibility but does not affect the underlying calculations or definitions associated with a specific Metric.
- Spotlight preferences control visibility but not underlying calculations or definitions. Spotlights cannot be configured by you, they are automatically generated and surfaced based on the aforementioned triggers.
- Dismissing Spotlights or filtering Metrics by time period, location, or data quality changes only what you see not the calculation.
- Monthly data refreshes keep your personalization current. As new claims flow in, your Metrics are recalculated with the latest data and new Spotlights are generated. This ensures your Practice page always reflects your most recent patterns.