
Practice: Overview
- What It Is
- Clinical Use Case
- Key Capabilities
- Data Sources
- How To Access
- Important To Remember
- Related Articles
What It Is
Practice provides you with a 360 view of your practice as an individual clinician, ranging from metrics on the care you provide, to metrics and other features surrounding how you are compensated, referral opportunities, and coding and denial patterns by using the real-world data tied to your NPI.

Clinical Use Case
Practice gives you visibility into your practice patterns that live outside of the EHR and other systems. Updating data surfaces personalized information to learn where your care is strong, where patterns are shifting, and opportunities to improve, all against peers in your specialty who treat similar patient populations.
Key Capabilities
- Spotlights: Weekly system-generated highlights surfacing Metrics where you statistically stand out the most, no configuration required.

- Clinical Performance tab: Provide a view into the care you give, clinical quality and improving care quality.
- Metrics cards: Specialty-specific performance indicators across clinical, quality, productivity, financial, and compensation categories tied to your real-world NPI data.
- Drill-Down View: Find the description and calculation rules for a given metric alongside time trends graphs, peer comparisons, and patient cohort breakdowns by age, sex, race, and insurance type for the selected Metric.
- Metric Favorites: Select and prioritize the Metrics most relevant to your specialty and practice style.

- Financial Performance: Improve your financial compensation or position with Metrics featuring coding patterns, referral visibility, and compensation benchmarking.
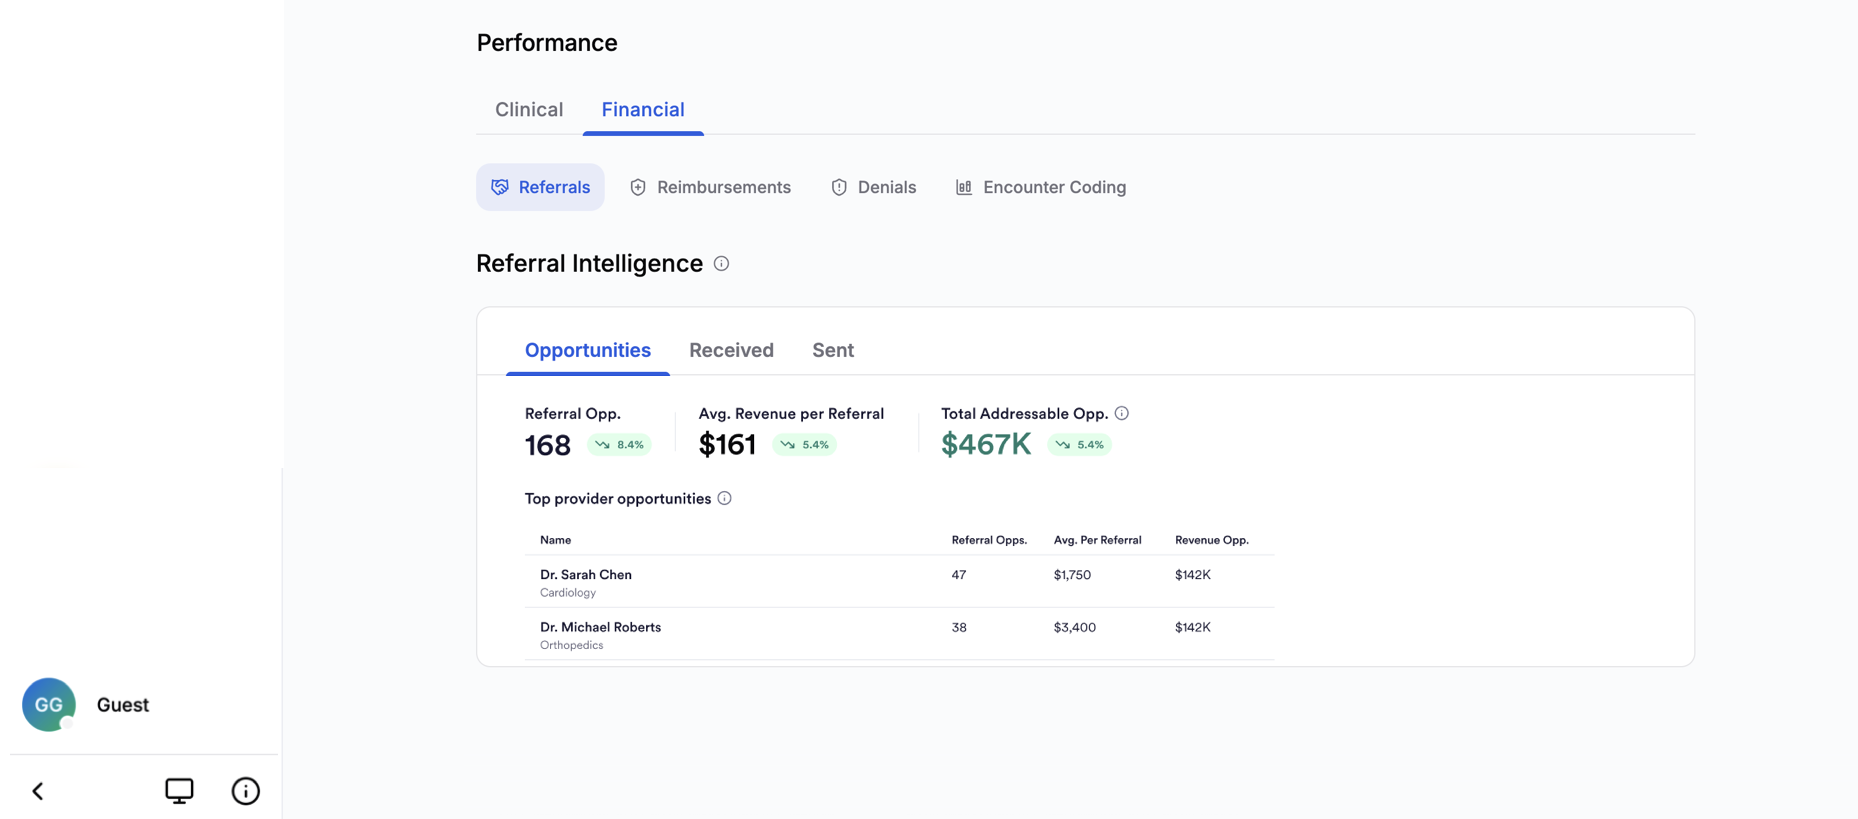
- Referrals: Inbound and outbound referral relationships derived from claims data, including average time from referral to completed encounter and estimated revenue.
- Reimbursements: Gain insight to your reimbursements including actual reimbursed claims from real-world data alongside your own negotiated rate.
- Denials: See what is driving your denied claims, which payers are responsible, and how your denial rate compares with peers.
-
Encounter Coding: Understand how you code your office and outpatient encounters over the last 12 months compared to peers.
- Scoped to your NPI: Everything on your dashboard is scoped to your NPI, only claims and patients attributed to your NPI populate your Practice page.
- Peer benchmarking: Compare your practice patterns with specialty-matched peer cohorts at the facility, state, and national level.
- Specialty selection: Your selected specialty determines your peer group and Metrics shortlist. You can update it any time in profile settings to reflect your daily practice.
Data Sources
Where The Data Comes From
- Medical claims data (open, closed, qualified entity, and pharmacy) attributed to your NPI
- Negotiated rates that come from transparency-in-coverage published negotiated rates associated with your NPI
To learn more about your data and how it updates, view the Data Sources document.
How To Access
You will load into Practice after you sign in to Jiro. Practice is also accessible from the main navigation bar in Jiro, found on the left hand side of the browser.

On iOS, the navigation bar is located on the bottom of your screen.

Select the Practice tab to open the interface and view your Spotlights, Clinical Performance Metrics, and Financial Performance.
Upon entering Practice, Spotlights are available at the top of the page, with Metrics surfaced based on your selected specialty shown in the Clinical tab of the Performance section. Click the Financial tab to access Referrals, Reimbursements, Denials, and Encounter Coding.
Important To Remember
- Practice data is derived from claims and reflects billed encounters only. Activities that were not billed to a payer are not captured.
- Clinicians with smaller patient panels may see more volatile Metric values or may not see certain Metrics until sufficient data accumulates.
- Referrals are tracked when you are listed on the referral as the referrer, or when you receive the referral and have someone else as a referrer on that claim.
- Pharmacy data relies on NDC code mappings, which may be incomplete for some drug categories.
- Certain patients are excluded from Metric calculations by design, for example, patients who passed away or were hospitalized during the measurement period are removed from the denominator, these can be seen in specific Metric calculation rules.
- Peer benchmarking is based on your selected specialty, it is important to select the right specialty to be benchmarked against. If you practice across multiple specialties, the benchmark may not reflect your full clinical scope.
- Your number of patients may appear off if you are attending as claims may be attributed to you even though you were not the performing clinician.
- The same applies if you are a fellow or resident, claims may not be attributed to you even though you were the performer, these claims may be attributed to the attending.