
Clinical Performance: Overview
- What It Is
- Clinical Use Case
- Key Capabilities
- Metric Categories & Corresponding Metrics
- How To Access
- Important To Remember
- Related Articles
What It Is
The Clinical Performance section of Practice houses your Metrics, the primary data view within Practice. They display dozens of pre-computed practice indicators based on your specialty selection, derived from de-identified, aggregated real-world data attributed to your NPI, across outcomes, quality, productivity, financial, and compensation domains based on your specialty. Each Metric is benchmarked against specialty peers at the facility, state, and national level.

The clinical tab organizes Metrics into six categories: Patients, Medications, Procedures, Utilization, Care Coordination, and Outcomes.
Clinical Use Case
The Clinical tab gives you a structured, specialty-relevant view of your practice patterns relative to peers through Metrics. Use them to identify where your practice diverges from typical patterns, to track how those patterns shift over time, and to inform conversations about clinical or operational priorities. Metrics are intended as a starting point for reflection, not as a definitive audit of clinical performance. The more recent view you select, the less reliable the Metric output.
Key Capabilities
-
Metric cards are pre-computed and tailored to your self-selected specialty, updated automatically from real-world data associated with your NPI. Each card shows the Metric name, your calculated stat, your peer comparison, your score, peer score, and the time period (Month/Year) at the bottom of the card.
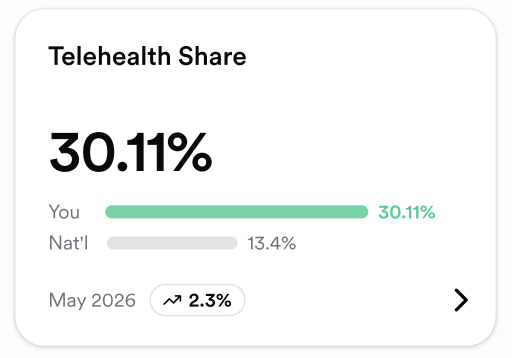
- Peer benchmarks are displayed on a Metric card below your statistic, based on your self-selected specialty.
- Blue bars are for neutral metrics where there directionality is not present.
- A Red bar indicates that you have a value below your peers in the Metric’s directionality. For example, both a lower Breast Cancer Screening Rate and a higher value for ED Return After Discharge.
- Green bars signify that you are outperforming peers. Green is displayed when a higher value is better for a Metric such as Medication Adherence or a lower value is better like in Hospital Readmission.
- Drill-down views provide a more detailed view of a Metric, including:
- A trend pill showing the relative difference between your most recent month and the month prior, using the same color logic as peer comparison bars, except neutral is shown in gray.
- Description and Calculation dropdowns explaining how the Metric is defined and calculated.
- A favorite button and feedback buttons.
- A time trend line graph based on your own historical data, ending on the most recent month that matches your data quality toggle. On web, hovering over a point on the graph shows the value for that specific month or year.
- A peer comparison bar graph showing your value alongside Facility (if applicable), State, and National averages. On web, hovering over the graph shows the value along with the number of clinicians (N) and number of patients (N) it was calculated on.
- A patient cohort breakdown by age, sex, race, and insurance type, depending on the Metric, based on your patients only. On web, hovering over the graph shows the type, value, and number of patients (N) it was calculated on.
- A data source and quality disclaimer.
- Recency Toggle: Latest, Recent, and Complete toggles.
- Location Filter: Isolate data by practice site if you work at multiple locations.
- Time Toggle: Monthly is the only currently available time toggle.
- Metrics Library: Clicking the Metrics library button to the top right of the Care Insights tab, you can select Metrics by clicking on the check box to the left of a Metric name.
- Favorites Selection: From the Metrics library, selecting the star to the right of a Metric name will favorite the Metric.
- Thumbs up/down Icons: Positively rate a Metric or flag values that appear inaccurate.
Metric Categories & Corresponding Metrics
- Favorites: Metrics you have selected as most important to your practice.
- Patients: Who are you treating?
- Average Age of Patients, Breast Cancer Screening Rate, Comorbidity Index, Outpatient Visit Share, Gender Percentage, Prevalence Metrics, Unique Patients Seen.
- Medications: Prescribing patterns, medication adherence, drug interactions, polypharmacy, and pharmacy spend.
- Early Prescription Metrics, Generic Shares, Hyperpolypharmacy/Polypharmacy Rates, Innovative Prescription Rates/Shares, Medication Adherence, Pioneer Prescriptions/Shares.
- Utilization: ED visits, hospitalizations, imaging orders, lab/pathology, and specialist referrals.
- Inpatient Length of Stay Metrics, Average Labs Metrics.
- Care Coordination: Transitions of care, post-discharge follow-up, and referral follow-through.
- Follow-Up After ED/Hospitalization Metrics, Return Visit Rate Metrics, Telehealth Encounter Share, Weekend Encounter Share.
- Outcomes: Readmission rates, complication rates, and chronic disease control.
- ED Return After Discharge, Hospital Readmission.
How To Access
Clinical Performance is housed on the bottom half of Practice and can be access by scrolling downward on the Practice page. The clinical tab is the default view for the Performance section.
Important To Remember
- Metrics are displayed as rates or percentages, not absolute patient counts. Results reflect patterns, not a complete clinical record.
- Data is directional, not exact. The more recent view you select, the less reliable the metric output.
- Patients who pay out of pocket, encounters that are not billed, or billing errors may create gaps in the underlying data. Treat values as directional.
- Some Metrics will not display if the sample size is too small for a statistically meaningful comparison. Any Metrics that do not display will contain N/A.
- Peer comparisons are based on your self-selected specialty. If your self-reported specialty is not the specialty you want to be benchmarked against, you should update your specialty.
- Metrics are not intended for emergency clinical decisions or real-time patient care.