
Data & Definitions
- Overview
- Data Source
- Your Patients
- Measurement Period
- Payer Types
- Data Lag
- Data Coverage
- Peer Benchmarks
- Metric Categories
- Important To Remember
- Related Articles
Overview
Understanding the data behind your metrics helps you interpret what Jiro surfaces and use it with confidence. This article defines the key terms and concepts that appear throughout the platform.
Data Source
Jiro draws on real-world data, insurance claims submitted by providers and processed by payers across the healthcare system. This is not data you enter or upload. It is derived from claims that already exist in the system, tied to your NPI.
The underlying dataset covers medical claims, pharmacy claims, and patient eligibility records sourced from both open and closed claims networks. Open claims come primarily from clearinghouses and capture activity across multiple payers. Closed claims come from individual insurance plans and capture insured patient activity. Together, these sources provide a broad view of your clinical activity as reflected in the claims record.
Your Patients
Your patients refers to the panel of patients attributed to you based on your NPI appearing on their claims during the measurement period. Attribution is determined by your role on each claim, as the ordering, performing, or rendering physician, depending on the claim type and service context.
Attribution is based on claims data, not on any roster or panel you manage directly. Patients you treated whose claims do not include your NPI, for example, claims billed under a group NPI without individual attribution, may not appear in your attributed panel.
Measurement Period
The measurement period is the time window used to calculate a given metric. Most metrics in Jiro use a rolling 12-month measurement period. This means the metric reflects the most recent 12 months of claims data available for your attributed patients, updated as new data arrives.
Some metrics use shorter windows (for example, 7-day or 30-day follow-up rates) that define a specific interval relative to an anchor event, such as a hospital discharge. The measurement period for those metrics is defined within the metric itself and is noted in the metric description
Payer Types
Metrics and patient data in Jiro are stratified by payer type, allowing you to view your practice patterns across different insurance populations:
Commercial: Employer-sponsored and individual market insurance plans.
Medicare: Federal insurance for patients 65 and older and qualifying patients with disabilities. Includes both traditional Medicare and Medicare Advantage plans.
Medicaid: State and federal insurance for qualifying low-income patients. Includes managed Medicaid plans.
Where data is available, you can filter or view metrics separately by payer type. Not all metrics are available for all payer types, depending on data availability for your attributed panel.
Data Lag
Data lag refers to the delay between when a clinical encounter occurs and when the corresponding claim appears in Jiro. Claims do not arrive in real time. Typical lag windows are:
- Open claims (clearinghouse-sourced): approximately 6–8 weeks from date of service
- Closed claims (payer-sourced): approximately 6 months or longer from date of service
- QE closed claims: approximately 9 months or longer from date of service
- Pharmacy claims: 2-4 weeks following the date of service
As a result, recent activity, encounters from the past one to three months, may be underrepresented in your metrics. Metrics are most reliable for activity that occurred more than six months prior to the current date.
Data Coverage
Data coverage refers to the proportion of your total clinical activity that Jiro captures in its claims dataset. Because claims reach Jiro through specific data partnerships, not all claims submitted under your NPI may be included.
Coverage varies by geography, payer mix, and practice setting. Where coverage is limited, metrics may reflect only a portion of your actual patient activity.
When coverage is low or unavailable, Jiro falls back to specialty- and location-level benchmarks rather than personalized metrics, so you still receive relevant context for your practice.
Peer Benchmarks
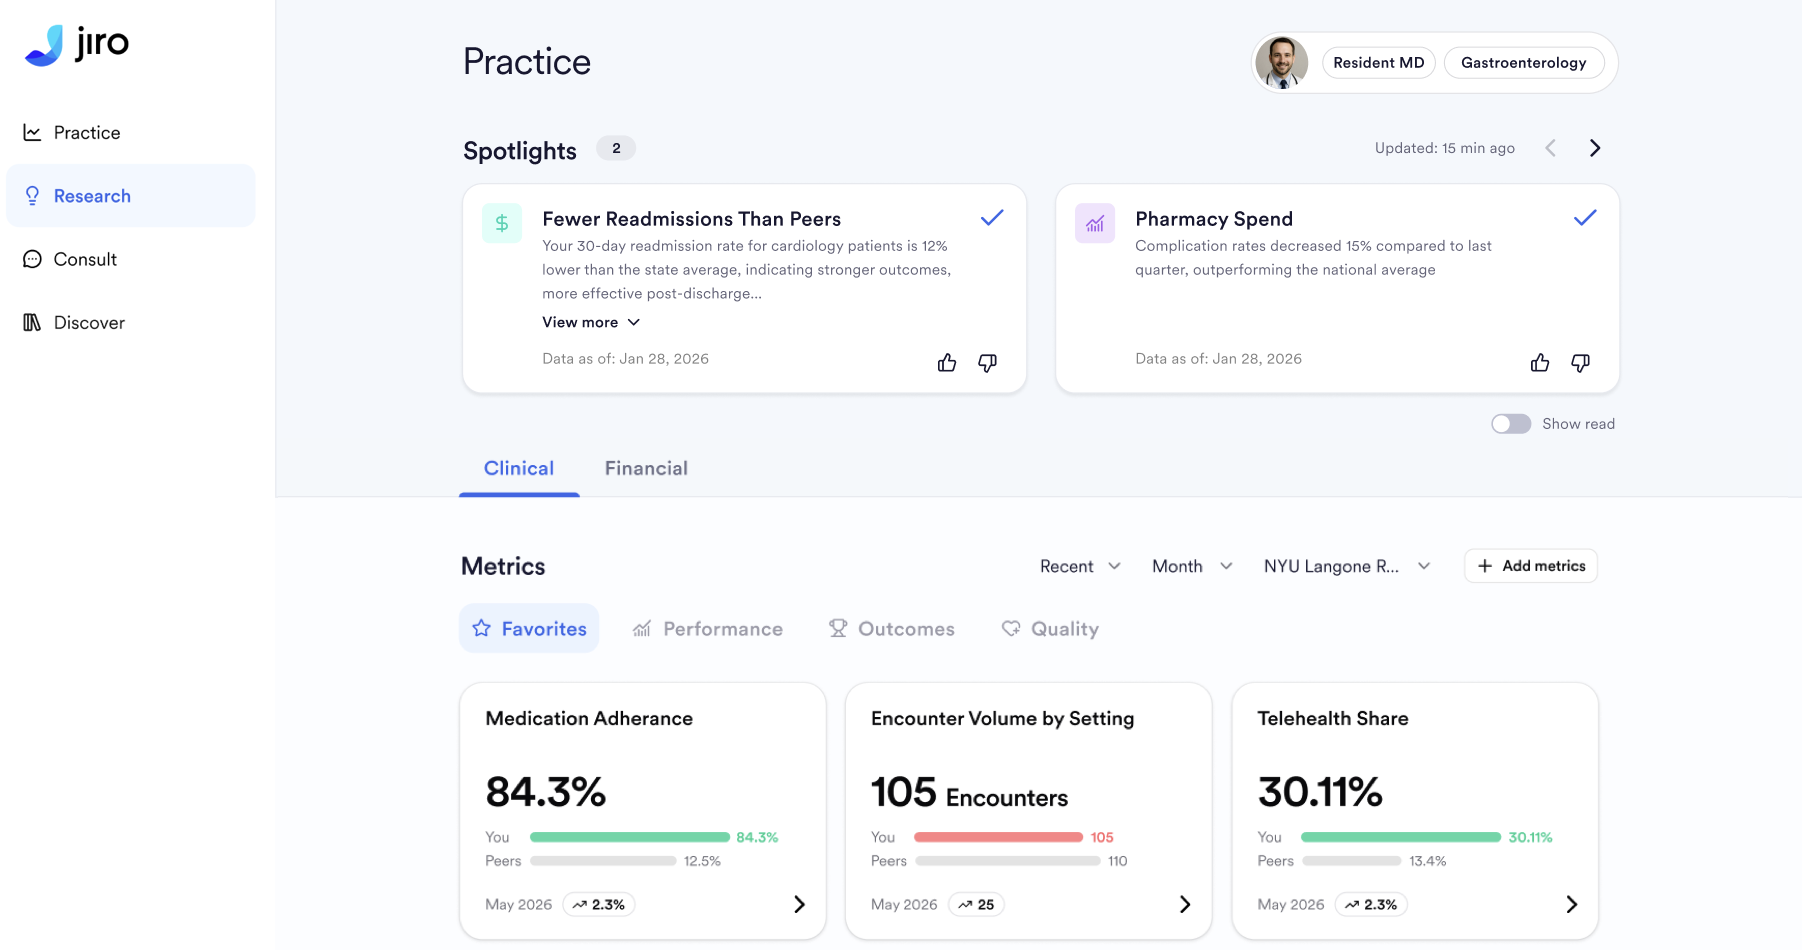
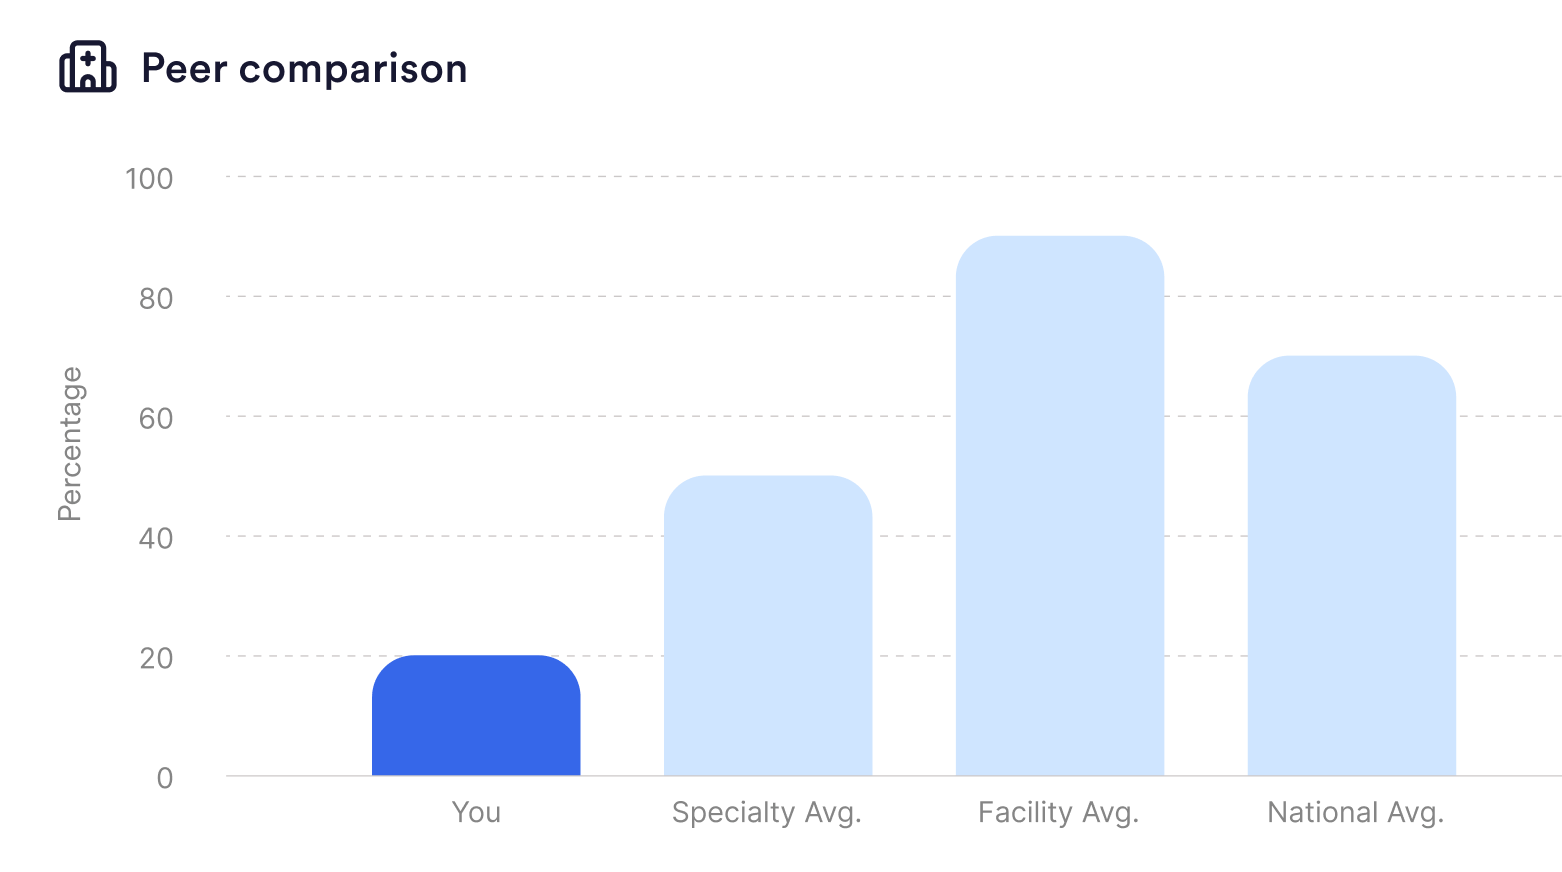
Peer benchmarks compare your metric values against other physicians in similar practice contexts. Benchmarks are calculated from the same real-world data that powers your personal metrics, ensuring the comparison population reflects actual practice patterns rather than self-reported or survey-based data.
Benchmark cohorts are defined by specialty and, where sufficient data is available, by practice location. Benchmarks provide context for your own data, they reflect how your practice compares to peers in similar clinical environments, not a performance evaluation.
Metric Categories
Metrics in Jiro are organized into seven categories:
Patients: Who are you treating?
Medications: How are you medicating patients?
Procedures: How are you treating patients?
Utilization: How are you using resources?
Care Coordination: How are you coordinating your care?
Outcomes: What are your results?
Finance: How much money are you making?
Each metric includes a description, the direction of the preferred outcome (higher or lower), and the benchmark against which your value is compared. For a detailed view of what Metrics fall in each category, visit the Metrics: Overview page.

Important To Remember
- Real-world data reflects activity captured in the claims record. Clinical activity that does not generate a claim, such as uncompensated care or out-of-pocket-only encounters, is not reflected in Jiro Metrics.
- Attribution logic follows established industry standards, including HEDIS, CMS, and AHRQ frameworks, adapted for the claim types and data available in the Jiro dataset.
- Data is refreshed on a regular cadence as new claims become available. Individual Metrics may update on different timelines based on their individual definitions and calculation rules.