How The Financial Tab Is Personalized
- Overview
- What Your Referral View Shows
- What Your Procedural Reimbursements Show
- How The Data Is Scoped To You
- What You Have Access To
- Related Articles
Overview
Referrals surfaces your personal referral network: who sends patients to you and who you send patients to. The data is specific to your NPI and derived automatically from real-world data. No configuration is required. Procedural reimbursements provide insight into procedure codes where you are reimbursed above or below your state median, along with your potential largest reimbursement.
What Your Referral View Shows
The Referrals section is organized into three directions:
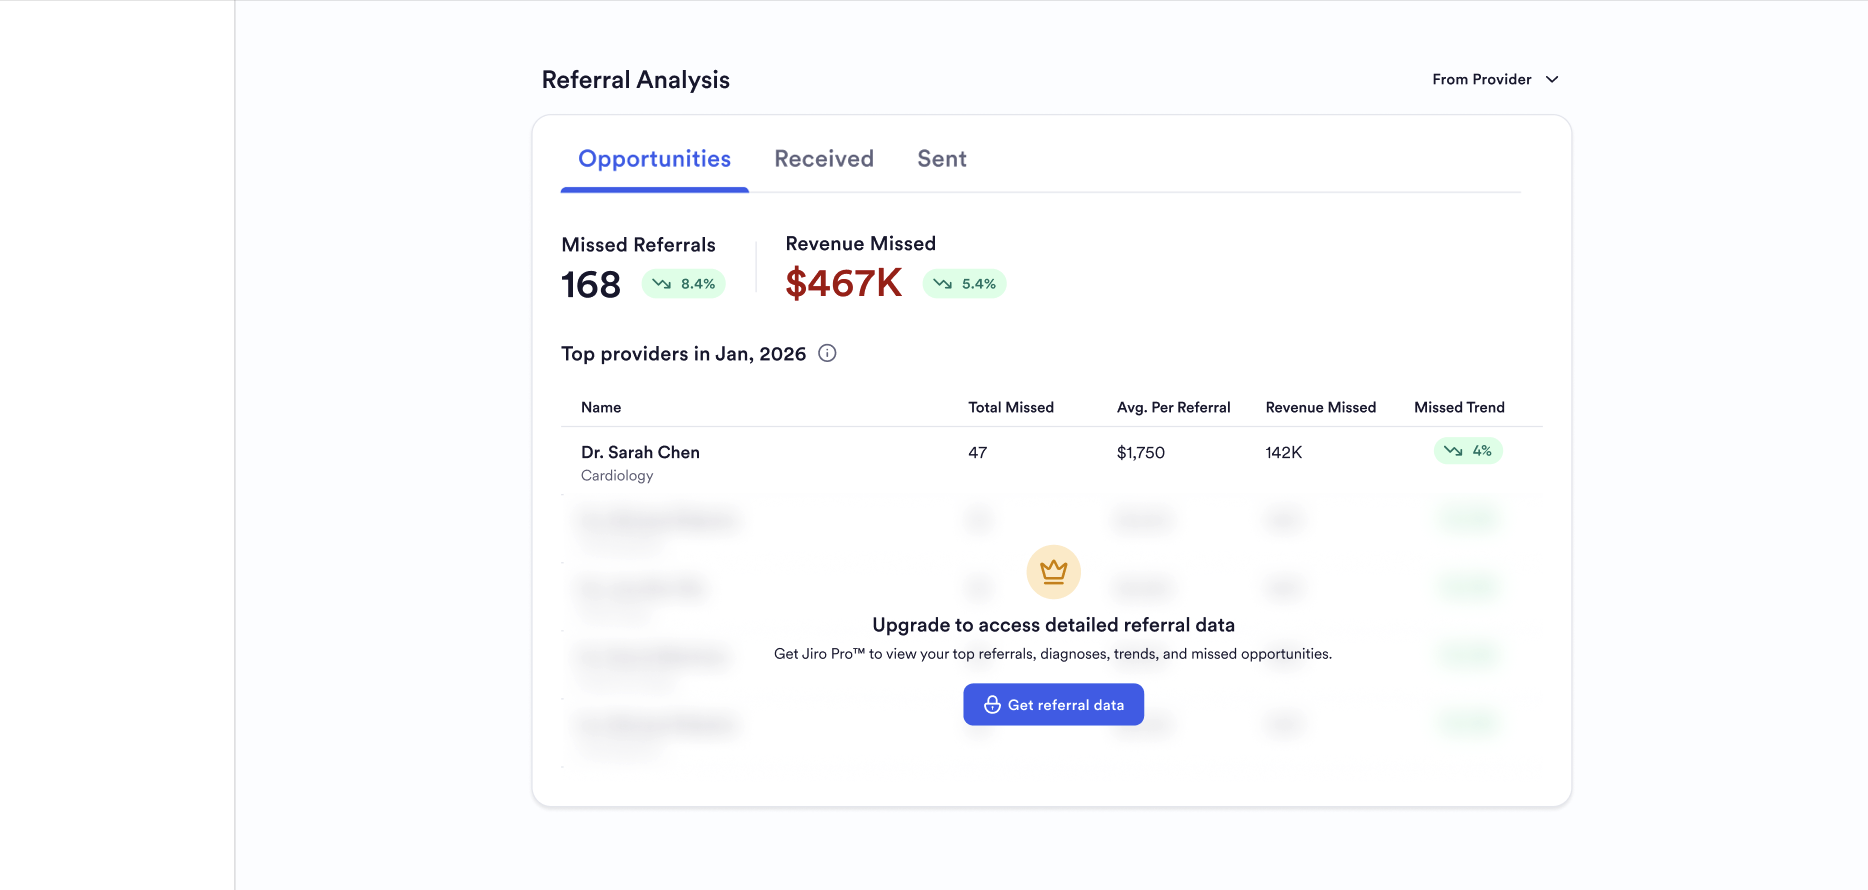
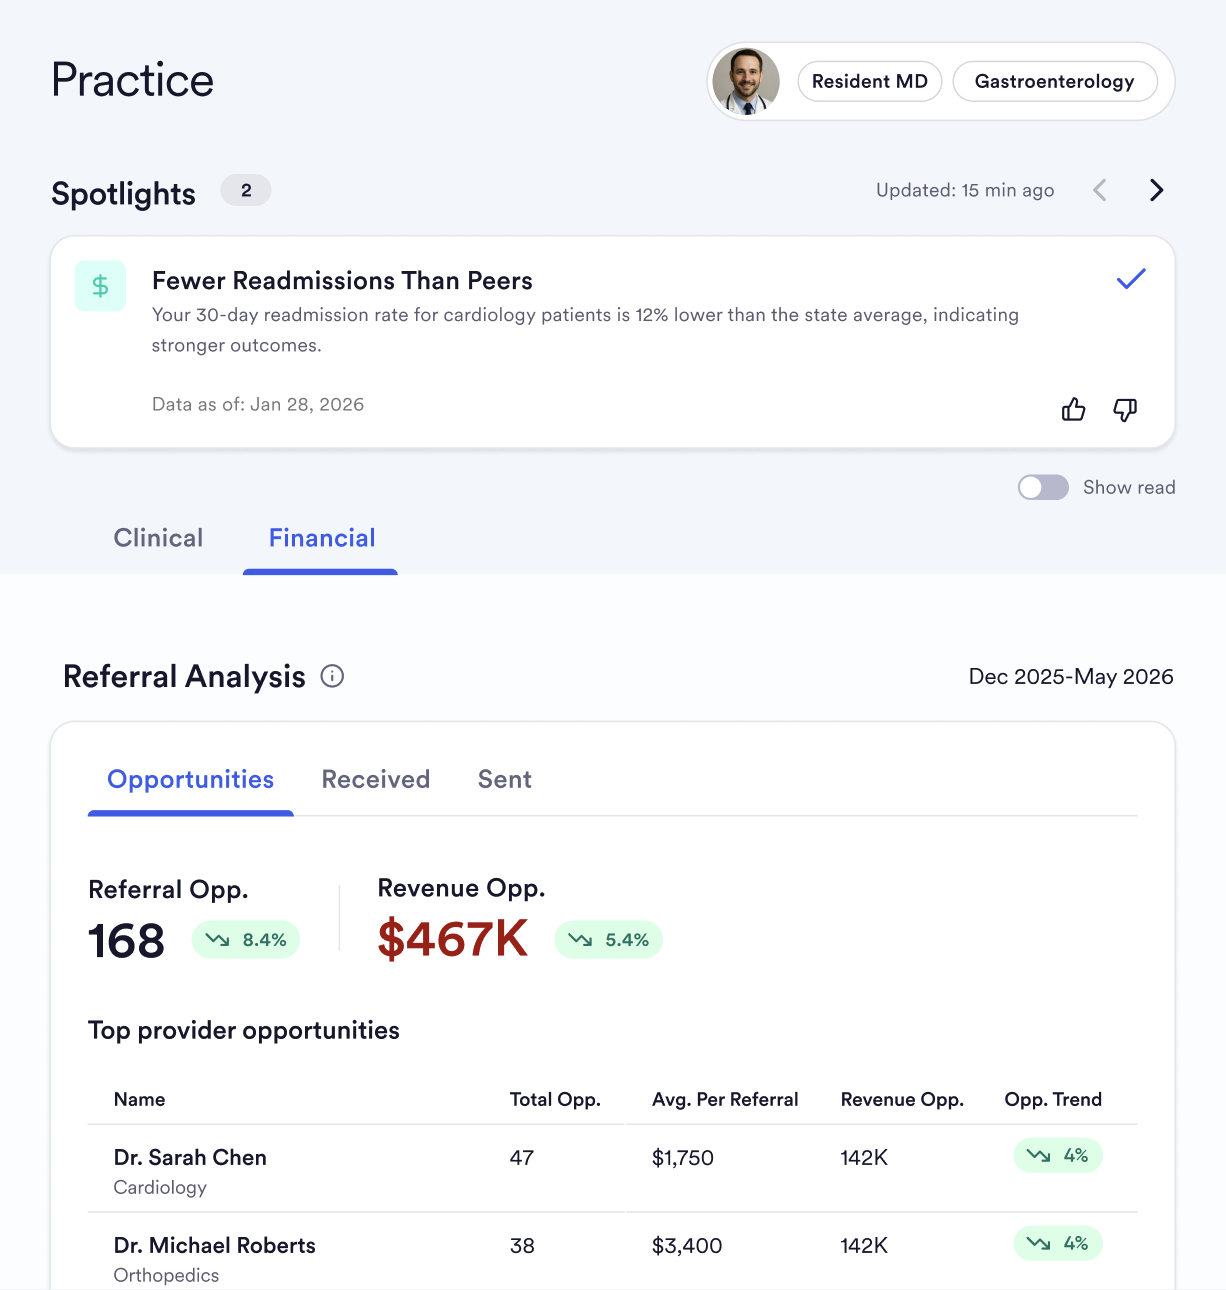
Missed: Shows you where other providers are sending referrals in areas you cover to other clinicians. Entries are organized by referral amounts and dollar amounts the referral could potentially earn.
Received: Shows the providers that refer patients to your practice. Entries are ranked by the dollar amount the referral created, with month-over-month change displayed alongside each.
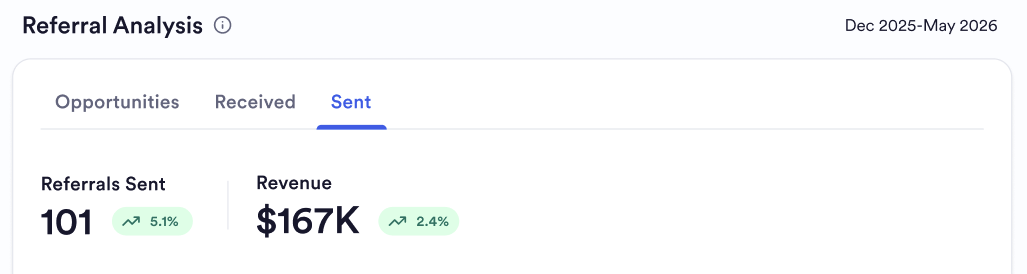
Sent: Shows where you send patients, the providers you refer to most frequently. Entries are ranked by the dollar amount the referral created.
The Received and Sent views are currently available at all Jiro subscription tiers, while the Missed section is limited to Jiro Pro subscribers.
Each tab also highlights two summary metrics: the total number of referrals in the measurement period and the revenue associated with the listed referrals.
What Your Procedural Reimbursement Shows
Procedural Reimbursements highlights a topline summary of procedures in which you were reimbursed above and below the state median for your peers. Your largest opportunity for reimbursement is also highlighted on the topline with a procedure code and payer.
Your Top 10 procedures by revenue opportunity are surfaced below by code and a description or payer. By clicking on a procedure, the row will expand to show you a per-payer breakdown of the procedure code with the top five payers by volume for the procedure.

How The Data Is Scoped To You
Jiro identifies your referral activity and procedural reimbursements by your NPI. When the section loads, it queries real-world data to build a view specific to your practice. That view reflects:
Explicit referrals only. A referral appears in your data only when a referring provider is named on the underlying claim. Verbal recommendations, patient self-referrals, and referrals that do not produce a named referral on the claim are not captured.
Completed referrals only. Only referrals that resulted in a completed visit are included. Referrals that were initiated but never resulted in an encounter are not visible , this is a constraint of real-world data, not a filter applied by Jiro. As a result, average completion time reflects patients who were ultimately seen, not those who were lost to follow-up or who waited and disengaged.
Self-referrals excluded. Encounters where you are both the referring and receiving provider are excluded from referral counts and percentage calculations. Approximately one in three referral-linked claims involves a self-referral; these are excluded because they do not reflect the referral relationships the section is designed to surface.
Peer comparison and location. Procedural reimbursements are tied to your NPI and use a geographic waterfall, starting with county, then state, and lastly national peers to highlight peer comparisons. The comparisons are anchored to your dominant billing location. Medians are used throughout procedural reimbursements.
Data lag and window. Real-world data has inherent timing constraints. Open claims carry a minimum lag of approximately two weeks; closed claims have an average delay of approximately four months. Referral activity from recent months may not yet appear in your view. Procedural reimbursement uses a 12-month rolling window ending in the most recent complete month.
What You Have Access To
Access to the Referrals and Procedural Reimbursement sections depend on your subscription tier.
All users can see aggregate summary metrics: total referrals received, total referrals created, and average days from referral to completed encounter in both directions. This can also be viewed in the drill-down menu.
Jiro Pro subscribers can see the named physician-level drill-down , the top referring and receiving providers by name, along with their missed referral opportunities. This is the primary view for understanding your referral relationships at the individual provider level. Jiro Pro also provides full access to Procedural Reimbursement information.
Enterprise access (HCO and system-level views) is available to health system organizations. Availability and scope at your organization depend on your organization's plan.