
Financial Performance: Overview
- What It Is
- Clinical Use Case
- Referrals
- Reimbursements
- Denials
- Encounter Coding
- How To Access
- Important To Remember
- Related Articles
What It Is
The Financial tab surfaces the financial side of your practice through four capabilities: Referrals, Reimbursements, Denials, and Encounter Coding.
Clinical Use Case
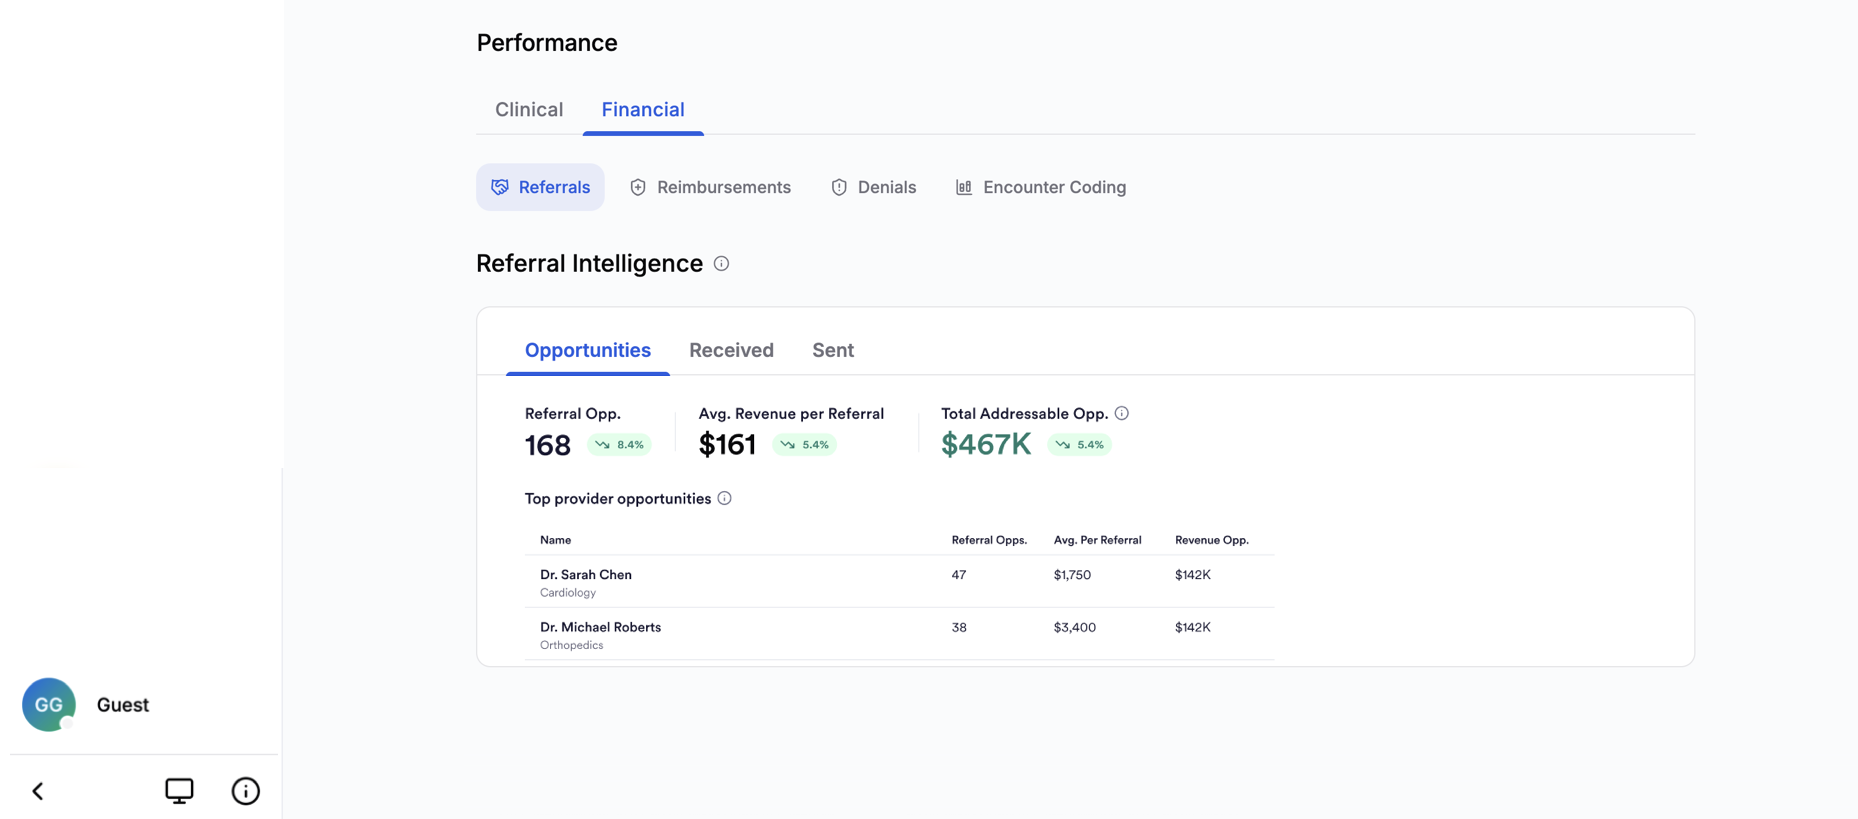
Monitor your Referrals. Based on real-world claims data across the last 12 months. The Opportunities tab shows referrals in your market you could capture, the Received tab shows referrals you received, and the Sent tab shows referrals you sent to others.
Notice gaps in your reimbursement. Compare your reimbursement to peers over the last 12 months. The Reimbursed tab shows what payers actually paid on your claims. The Negotiated tab shows the rates you have contracted with payers.
Understand what is driving your denied claims. The Denials tab shows a comparison to peers over the last 12 months, highlighting which payers are responsible and how your denial rate compares with peers. Only fully denied claims are included. Claims that were paid but had an individual service line denied are excluded.
Learn about your Encounter Coding. See how you code your office and outpatient encounters over the last 12 months compared to peers. The top-line bar shows the mix of coding systems you use for these encounters versus peers.
Referrals
Referral Intelligence: Clicking into the Financial tab of Practice's Performance section will land you in Referrals. Referrals surfaces referral pattern data derived from real-world claims, giving you a view of who is referring patients to you, who you are referring patients to, how long those referrals take to result in care, and where there may be untapped growth in your referral network.
Referral relationships are reconstructed from aggregated, de-identified medical claims based on what has actually been billed. This gives you visibility into referral activity that is typically inaccessible without population-level data.
The section is organized around three perspectives:
Opportunities: Referrers that could have referred patients to you, based on the patient's geography, specialty, and diagnosis, but were referred to someone else.
Received Referrals made up of existing referrals, which you have received from other clinicians.
Sent Referrals made up of existing referrals, which you have sent to other clinicians.

Reimbursements
Reimbursement Intelligence: The Reimbursement Analysis card has two independently-filterable tabs, Reimbursed (default) and Negotiated. Both benchmark you against specialty and geographic peers using a geographic waterfall (CBSA, then county if a CBSA is unavailable for your region, then state, then national), anchored to your top billing location by claim volume.
Both tabs share the same top-line items: Total Opportunity (over the last 12 finished months), Above Peers, and Below Peers. Above/Below Peers is listed as a raw number in the Reimbursed tab and as a percentage rate in the Negotiated tab.
- Reimbursed: How your reimbursement per procedure over the last 12 finished months compares to peers, by payer. Revenue opportunity shows how much more those claims would have generated had they matched the peer median. The table highlights your top 10 activities by total revenue opportunity, along with the associated code, description, payer, and total claims.
- Negotiated: How your contracted (negotiated) rates per procedure compare to peers, by payer. Revenue opportunity shows how much more your claims would have generated had your negotiated rate matched the peer median. As with Reimbursed, the table displays your top 10 activities by total revenue opportunity, along with the associated code, description, payer, and total claims.
Negotiated rate data is available for select payers only, with more payer coverage coming. Revenue opportunity is based on allowed amounts from professional claims.
Denials
Denial Intelligence gives you insight into where your claims are being denied by payers, relative to peers in your specialty and area.
- The top line displays your total claim loss from denials, your denied percentage of claims compared to the peer average, and your highest denial rate.
- A revenue impact table shows how your initial billed claims are affected by category. Categories include the top denial reasons (based on CARC codes) responsible for the most denials, plus an "Other" category that groups the remaining reasons. These are broken down by total loss in the table.
Encounter Coding
Encounter Coding: How you code your office and outpatient encounters over the last 12 months compared to peers, broken down by the mix of coding systems you use, RVU differentials, and complexity differentials.
How to Access
Open the Practice tab in Jiro and scroll down to the bottom half of the page, in the Performance section click the “Financial” tab. Selecting the Financial tab, will place you in the Referral tab with the Opportunities, Received, and Sent views available. Opportunities is the default view for referrals. To access Reimbursements, Denials, or Encounter Coding click on the corresponding icon.
Important To Remember
- Only referrals that resulted in a completed visit are included. Referrals where the patient did not follow through are not visible. Additionally, only referrals that resulted in a new patient visit will result in a referral. Established patient encounters cannot be distinguished from a new referral to a follow-up visit.
- Only claims where a referring provider is explicitly named are captured.
- Dollar amounts shown are estimates derived from claims data, based on billed procedures and standard reimbursement assumptions. They are not actual payment figures.
- Referral data is not meaningful for all practice types. Emergency Medicine, for example, does not have a traditional referral network. The section will display an appropriate notice when this applies.
- Opportunities reflect historical market context, not a recommendation. Any outreach decisions should be made using your own clinical and professional judgment.
- Data in this section reflects what has been submitted and processed, not current clinical activity.
- Medians are used for comparisons in Reimbursements, not averages, and quantify a potential gap rather than a predicted outcome of negotiation.